
If, when and by how much will inflation slow?
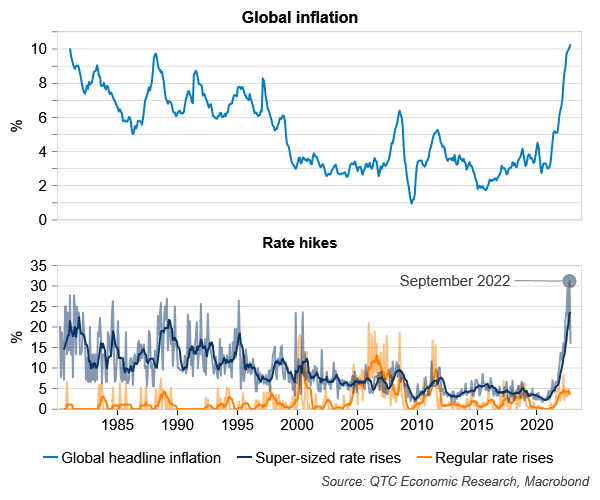
Global inflation is at a 40-year high and, as recently as September, central banks responded by deploying ‘super-sized’ rate hikes at a record pace (Graph 1). Given how the trajectory of interest rates is so closely linked to inflation, to gauge the path for interest rates it is critical to get a sense of if, when and by how much will inflation slow. To do this, I look at several of the key drivers of inflation at the current time including supply chain pressures, food and energy, and the state of the domestic economy.
Graph 1: Global headline inflation and interest rate hikes[1]
Supply chain pressures
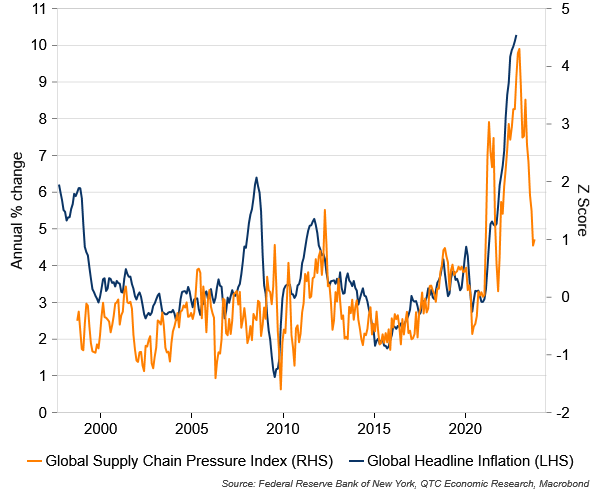
Over the past couple of years there has been a significant imbalance between demand and supply in the global and Australian economies. This has placed considerable pressure on supply chains and boosted inflation. Thankfully, softer demand and improving supply have seen these pressures moderate so far this year. This points to the prospect of lower global inflation on account of supply chain pressures over the year ahead (Graph 2).
Graph 2: Global inflation vs supply chain pressures
Food and energy prices
Increases in food and energy prices have made a substantial contribution to global inflation in recent years due to a range of factors, including weather variability and Russia’s invasion of Ukraine. However, futures prices for energy (Graph 3) and forecaster expectations for food (Graph 4) point to more muted impacts going forward. This could reflect the impact of higher prices for these items or the slowing economy weighing on demand.
Graphs 3 & 4: Proxy series vs food and energy inflation
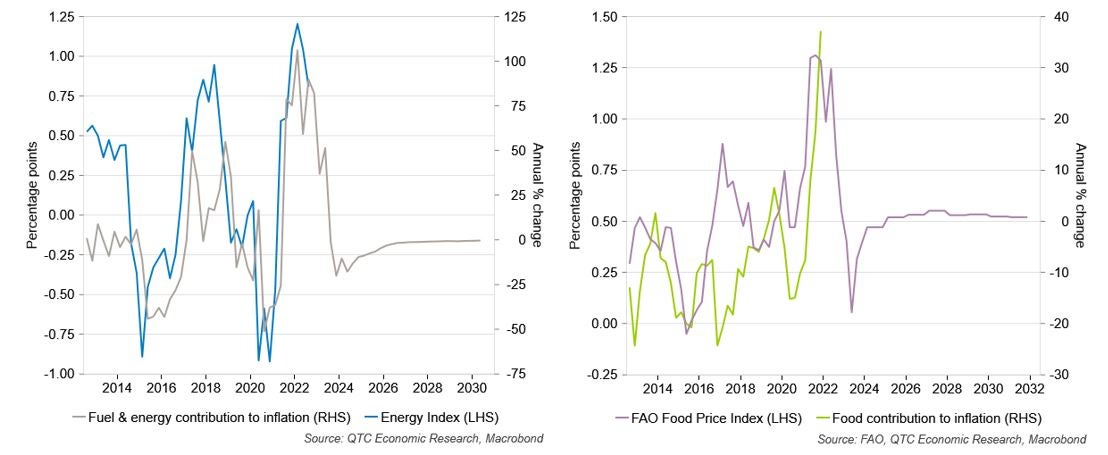
Note: The FAO Food Price Index is produced by the UN’s Food and Agriculture Organization (FAO). Forecast prices are available in the OECD-FAO Agricultural Price Outlook and projections here were constructed using these as well as the weights from the Food Price Index (link). The Energy Price Index is a subjectively weighted index of various sources of energy (for example, gas and coal). It also includes oil prices to capture the impact of higher energy prices on those of petrol.
State of the domestic economy
Firm labour market conditions have contributed to high inflation in Australia. However, with labour markets around as tight as they are expected to get, the pace of labour market sensitive inflation should moderate over the coming years (Graph 5).
Graph 5: Labour market sensitive inflation vs the unemployment gap
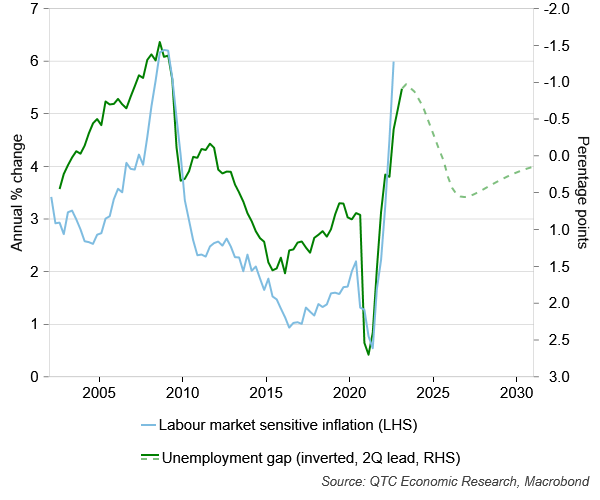
Note: RBA forecasts taken between Q4 2022 and Q4 2024. Thereafter, these were extended using the RBA’s MARTIN model.
Developments with respect to supply chains, food and energy prices, and the state of the domestic economy all point to inflation peaking around now. This suggests that inflation should ease over the coming year, though it’s likely to be a couple of years before it is back within the RBA’s target band.
Are we in stagflation now or could we see it?
‘Stagflation’ refers to the combination of high inflation, stagnant economic growth and persistently high unemployment. This was last observed at the global level in the mid-1970s and early 1980s following oil price shocks. If this occurred again, it would be extremely challenging for many in society as well as for policymakers. Thankfully, the world isn’t experiencing stagflation like in these earlier times as, while inflationary pressures are acute, GDP growth is slightly above average and unemployment rates are at multi-decade lows (Graph 6).
Graph 6: Stagflation episodes
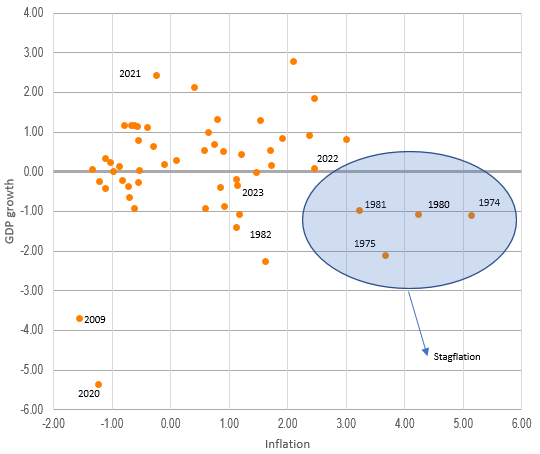
Source: IMF, World Bank, QTC Economic Research
Note: Axes show standard deviations away from the non-oil shock/non-COVID means for GDP (vertical) and inflation (horizontal). Unemployment rates were excluded due to lack of data before 1980.
While the world isn’t in stagflation, we have seen ‘stagflationary’ dynamics in that economic growth has slowed and inflation has accelerated. Further unforeseen food, energy or supply chain shocks could increase the chance of stagflation, as could a shift in firms’ and households’ ‘inflation psychology.’ However, there are many differences between the present situation and those in the mid-1970s and early 1980s (Table 1). This provides some comfort that we will not suffer a similar fate.
Table 1: Global stagflation – 1970s & 1980s vs now
| Issue | 1970s & 1980s | Now | Status |
| Inflation during shock | Double digits | Double digits | Identical |
| Inflation expectations | High | Have increased but still broadly anchored | Different |
| Wages | High | Not quite as high | Similar |
| Unemployment rate | Increased | Fell | Different |
| GDP growth | Negative | Positive | Different |
| Supply shock | Narrow set of energy commodities | Broader set of energy commodities + other goods | Different |
| Dominant driver of shock | Supply | Demand & supply | Different |
| Size of oil price rise | 4x (1973-74), 2x (1979-80) | From start of 2022 rose nearly 50 per cent in nominal terms to its peak, now ~10 per cent higher | Different |
| Reliance on oil for economic growth | High | Lower | Different |
| Reliance on gas for economic growth | Low | Higher | Different |
| Prior easy fiscal policy | Yes | Yes | Identical |
| Prior easy monetary policy | Yes | Yes | Identical |
| Central bank inflation fighting credentials | Poor | Strong | Different |
| Central banks behind the curve | Yes, and slow to rectify | Yes, but caught up | Different |
| Lack of flexibility in the economy (centralised wage setting, wage indexation, role of unions, wage and price controls) | More prevalent | Less prevalent | Different |
Source: QTC Economic Research, Anderson et al (2022), BIS (2022), Frankel (2021), Malpass (2022), Igan et al (2022), World Bank (2022)
How resilient might labour markets be?
Labour market conditions will be critical in determining the path for interest rates given the weight the RBA puts on these as a driver of inflation and as a barometer of the strength of economic activity. If conditions moderate in line with or more quickly than expected, the Bank will become increasingly comfortable slowing or ceasing interest rate rises. Conversely, if labour markets are more resilient than anticipated, the RBA will need to consider forging ahead with further rate increases.
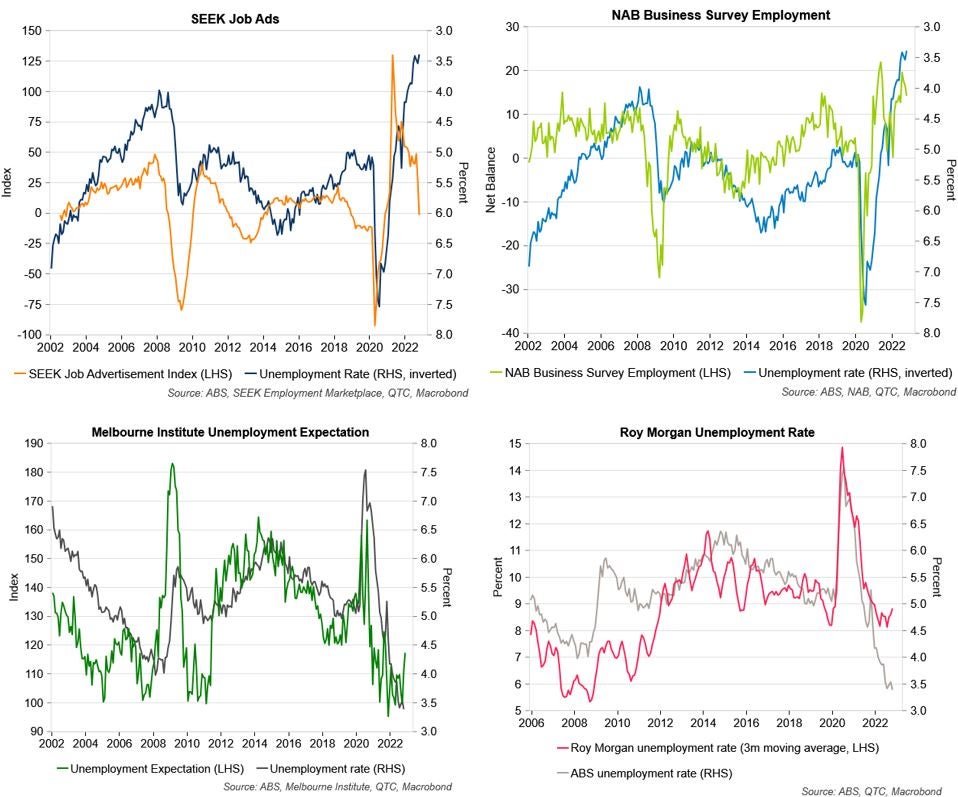
Given the slowing in the global economy as well as the lagged impact of cumulative interest rate rises here in Australia, it is expected that momentum in the local economy will fade in 2023. This should flow through into a softening in labour market conditions and a rise in the unemployment rate, an outcome which looks likely in the near-term based on several leading indicators (Graph 7).
Graph 7: Different leading indicators of the unemployment rate
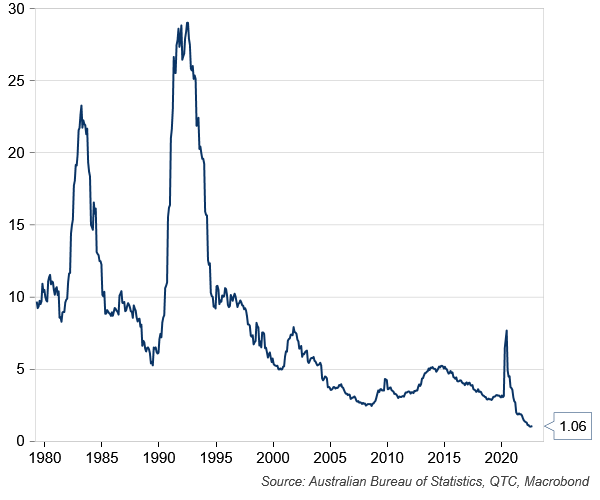
However, these leading indicators suggest only modest upwards pressure on the unemployment rate. This possibility is reinforced by the strong starting point for the labour market with there being a much lower number of unemployed workers available to fill each job opening in the economy than is typically the case at corresponding points of the cycle (Graph 8).
Graph 8: Number of unemployed people per job vacancy
This highlights the degree of mismatch between the demand and supply of labour currently in the Australian economy. It is possible that the difficulties businesses have encountered in attracting and retaining suitably skilled and experienced staff in recent years could make them keen to avoid the hassle of re-recruiting and be more inclined to hold on to staff even if the economy were to slow. This may be most apparent in the industries which have experienced the greatest divergence between labour demand and supply over the last few years. These industries continue to struggle to fill job openings with vacancies 180 per cent higher than pre‑COVID levels (Graph 9). Also, at around 45 per cent, these industries also make up a large share of total employment. These factors could contribute to labour markets being more resilient over the period ahead.
Graph 9: Job vacancies in high mismatch industries
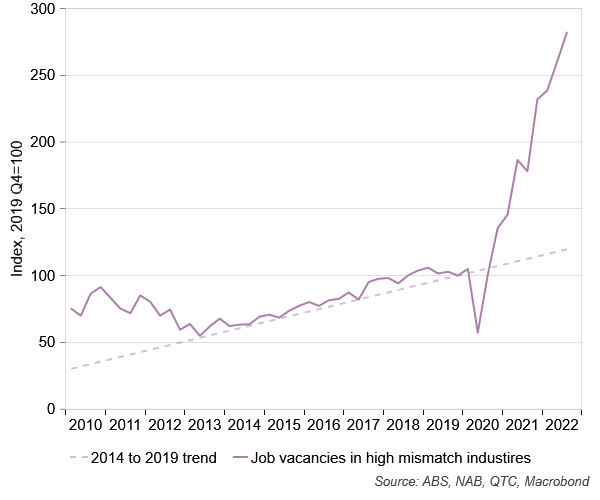
Note: ‘High mismatch’ industries are defined as those where the level of job vacancies relative to the pre-COVID level is above that for all industries
ImpIications
Based on the discussion above, next year expect inflation to moderate; for there to be no stagflation; and for the domestic labour market to prove somewhat resilient in the face of higher interest rates. Given how unpredictable things have become though, the answers to the 3 questions for 2023 should be considered tentative. Greater clarity will become available as 2023 unfolds in what should be another challenging year for the global and domestic economies given where we are in the economic cycle.