
Is inflation being driven by supply disruptions or stronger demand?
Whether inflation is driven by supply disruptions or stronger demand has important implications for monetary policy. Supply-driven inflation is typically both shorter-lived and less responsive to increases in interest rates. Because of this, the RBA is more likely to ‘look through’ the effect of supply disruptions. In contrast, monetary policy is well suited for reigning in strong demand, so the RBA tends to be more responsive to bouts of demand-driven inflation.
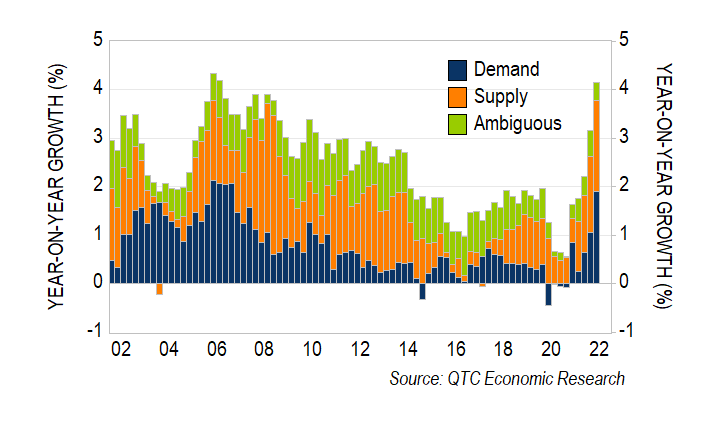
Zac Gross at Monash University outlines a simple approach to decompose Australian inflation into supply and demand drivers. My replication of this suggests that recent inflation outcomes have increasingly been driven by strong demand.[1]
Demand accounted for two-thirds of household consumption price inflation in the June quarter and around half of the increase over the past year, marking its largest contribution since 2007. The remaining price growth is estimated to largely reflect supply constraints, particularly for fuel, food and ‘furnishings and household equipment’. The results are similar if I update Zac Gross’s results for headline CPI inflation (which is shown in the technical appendix).
Graph 1: Contribution to household consumption price inflation
Have stronger labour market conditions started to flow through to inflation?
The increased contribution of demand to inflation may partly be explained by a tightening of labour market conditions. One way to assess this is to directly estimate the contribution of ‘labour market-sensitive’ CPI components to inflation outcomes, using an approach that I outlined in the previous QTC research article ‘What’s down with Australian inflation?’. [2]
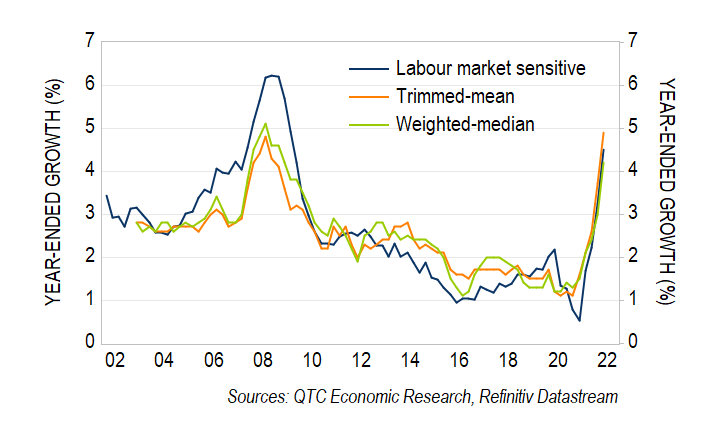
Labour market-sensitive inflation has a similar trend to other indicators of underlying price growth in Australia, though with slightly more pronounced cycles (Graph 2). This measure of inflation increased to 4.5 per cent in the June quarter, which is its fastest pace of growth since 2009.
Graph 2: Underlying inflation measures
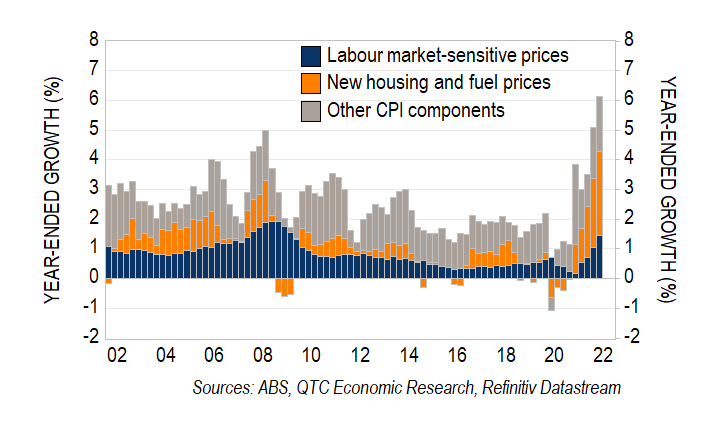
This increase in labour market-sensitive inflation partly explains the recent rise in headline inflation (Graph 3). It is estimated to have contributed 0.4 percentage points to quarterly inflation, which is around four times larger than its average contribution in the years prior to the pandemic. Nonetheless, this pick-up in labour market-sensitive inflation still only accounts for around a quarter of the increase in the CPI over the past year.
Just under half of the increase in prices over the past year is explained by new housing costs and fuel prices, neither of which have a significant relationship with domestic labour market conditions.[3] Higher fuel prices have predominately been driven by global supply disruptions as a result of the Russia-Ukraine war. The higher cost of new housing reflects a combination of supply disruptions and stronger demand, though the majority of the price increases have been driven by material rather than labour costs.
Graph 3: Contribution to headline CPI inflation
How consistent are these estimates?
The results of these decompositions are broadly consistent. The contributions of labour market-sensitive CPI components and demand-driven inflation have increased noticeably over the past year, with both measures at their highest level since the mining boom (Graph 4). Moreover, both estimates suggest that a combination of demand and supply drivers are important for explaining recent inflation outcomes, with the initial decomposition suggesting that demand and supply are of roughly equal importance.
Graph 4: Estimated contributions to year-ended inflation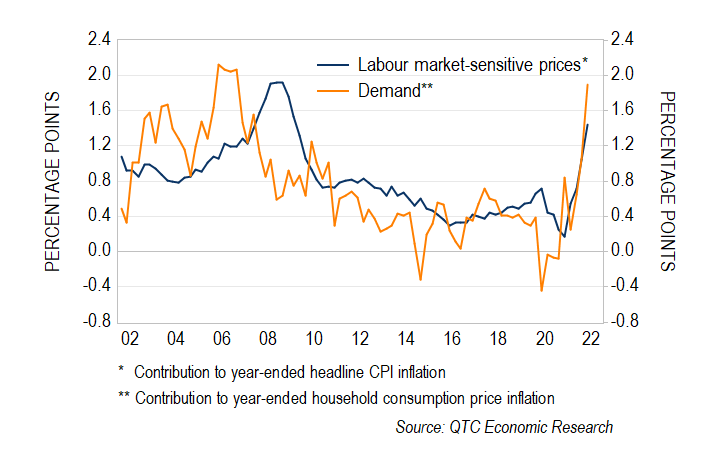
The estimates are also consistent with measures based on completely different methods. One such approach is principal components analysis, which allows us to summarise the common trends across all of the CPI components in just a few series.
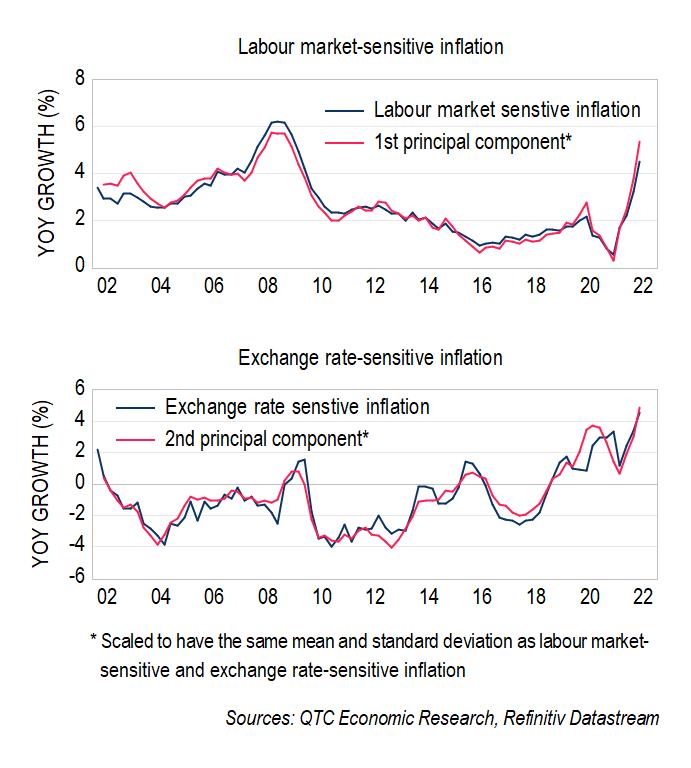
The first two principal components are highly correlated with our estimates of labour market-sensitive and exchange rate-sensitive inflation (Graph 5). The correlations are surprisingly strong, given these series were estimated using completely different techniques and assumptions. Taken at face value, this suggests that my estimate of labour market-sensitive inflation is picking up on the largest source of variation in the CPI data. It is also potentially a strong validation of using the Phillips curve to model inflation in Australia.
Graph 5: Principal components measures of inflation
Conclusion
The increase in inflation over the past year has been underpinned by disruptions to global supply-chains, strong demand and a historically tight labour market. In terms of magnitudes, I find that stronger demand may account for around half of the increase in prices in Australia over the past year. While there is some uncertainty around the size of these estimates, there is less doubt on the direction, with strong demand and tighter labour markets becoming increasingly important drivers of inflation in Australia. This suggests that inflationary pressures may be more persistent but should ultimately be responsive to interest rate increases from the RBA.