
Disentangling inflation outcomes
There are many ways to disentangle and quantify the factors underpinning low inflation. We have chosen to use a similar approach to Shapiro (2020) at the Federal Reserve Bank of San Francisco, with a few tweaks to match features of the Australian data. This framework uses a simple procedure to empirically group the 87 expenditure class components of the Consumer Price Index (CPI) into one of four categories (Graph 1).[2] This then allows us to assess how important each category is to explaining inflation outcomes.
Graph 1: Inflation estimates and categories
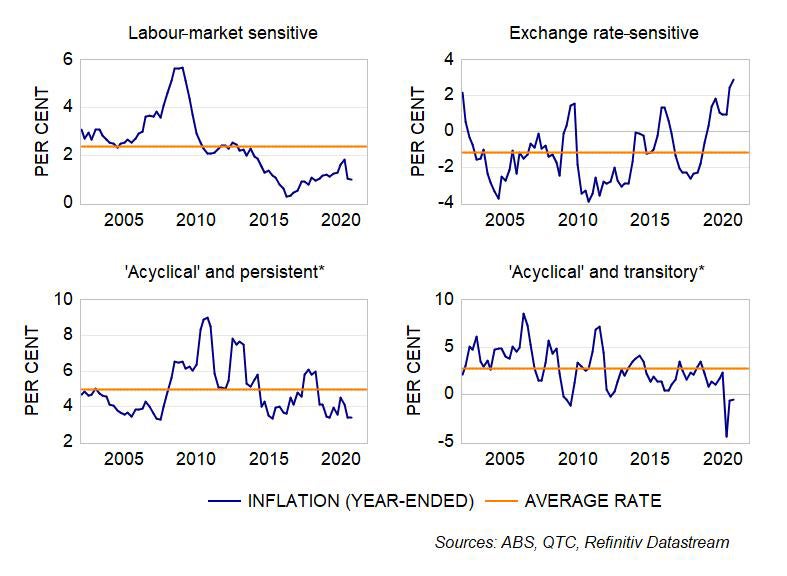
The different inflation categories are summarised in Table 1. Labour market-sensitive inflation represents CPI components that have a significant relationship with labour market slack (ie, the unemployment gap),[3] while exchange rate-sensitive components have a significant response to changes in the Australian Dollar (where this is expressed in trade-weighted terms).[4]
‘Acyclical’ components do not have a statistically significant relationship with either the unemployment gap or the trade-weighted exchange rate. We have further split these acyclical series into two categories, based on how volatile price movements are (ie, ‘persistent’ and ‘transitory’).[5]
Table 1
| Broad classification | Category | Weight (2019, %) | Examples |
|---|---|---|---|
| Sensitive to key macroeconomic drivers (‘cyclical’) | Labour-market sensitive | 34 | Dwelling rents, takeaway and restaurants |
| Exchange rate-sensitive | 12 | Motor vehicles, clothing, electronics | |
| Not sensitive to macroeconomic drivers (‘acyclical’) | Persistent | 19 | Utilities, tobacco, insurance |
| Transitory | 35 | Automotive fuel, fruit, vegetables, childcare |
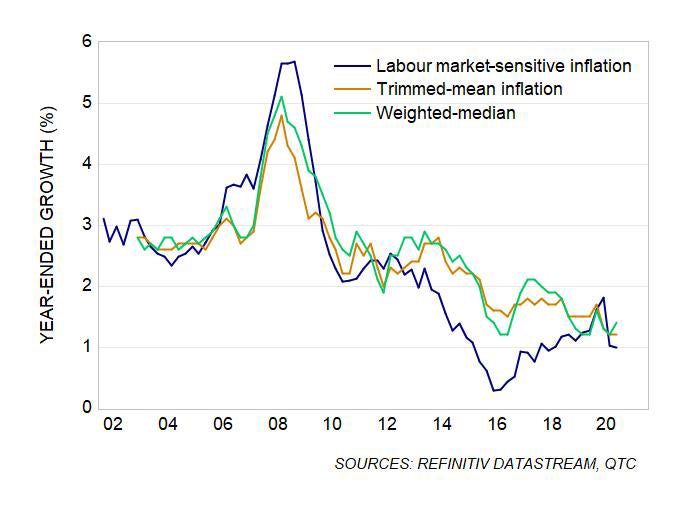
Labour market-sensitive inflation is of particular interest. It is a useful indicator of underlying cyclical inflationary pressures in the economy, as it excludes volatile items and prices that have a weak relationship with domestic economic conditions.[6] It should also isolate a key segment of the CPI basket that the Reserve Bank of Australia (RBA) is aiming to affect when it sets monetary policy (with the ‘exchange rate sensitive’ category being the other focal point). Our estimate of labour-sensitive inflation has a similar trend to other measures of underlying inflation in Australia, but with more pronounced cycles (Graph 2).
Graph 2: Underlying inflation measures
Low inflation has been underpinned by slack in the labour market
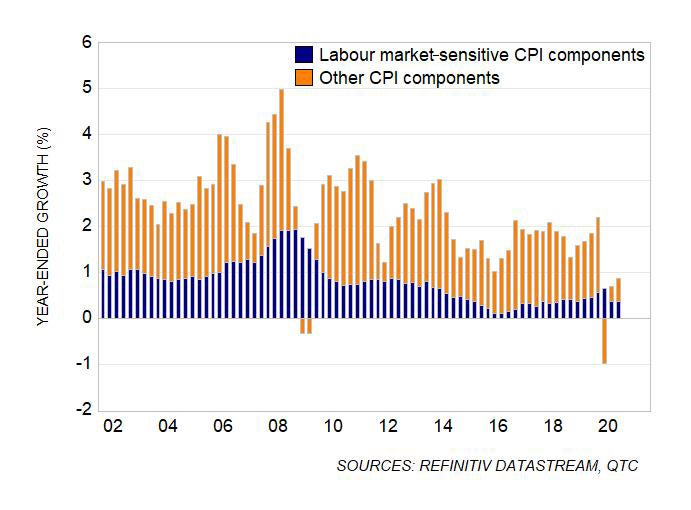
This work suggests that the low level of inflation over the past five years is largely explained by a weak labour market (Graph 3). Labour market-sensitive inflation averaged one per cent from 2015 to 2020—compared to three per cent in the decade prior to this. At its trough in 2016, annual labour-sensitive inflation was just 0.3 per cent.
Graph 3: Contribution to headline inflation
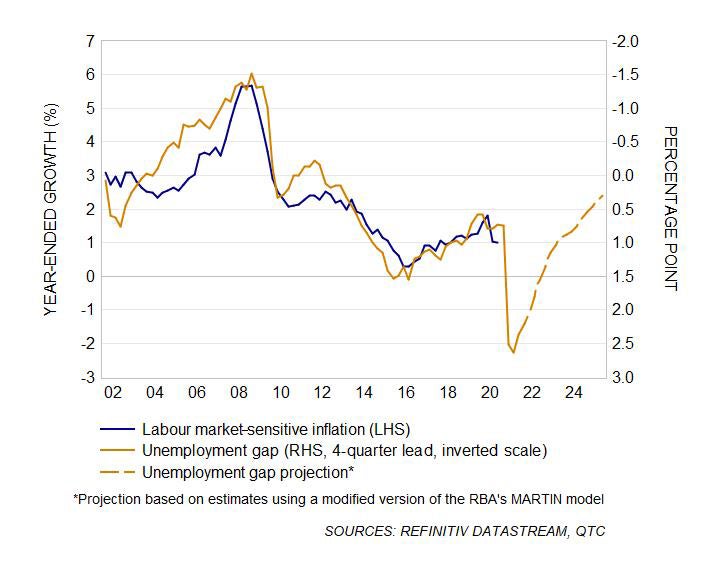
Inflation in this category is highly correlated with labour market slack (Graph 4). The gradual improvement in labour market conditions immediately prior to the pandemic had resulted in slightly higher labour sensitive inflation, though progress was slow, and the pace of growth remained weak relative to history.
More recently, the sharp deterioration of labour market conditions has had a smaller effect on labour-sensitive inflation than expected. This partly reflects strong increases in prices for some specific components during the pandemic, including household supplies, takeaway and restaurants, and some other food items. It could also reflect the swift economic recovery and an expectation that lower aggregate demand will be short lived.
We expect the correlation between labour market conditions and labour-sensitive inflation will remain weak over the coming year. As such, while labour market conditions are likely to continue to weigh on inflation in the short term, we do not expect this to result in a sharp fall in labour-sensitive inflation (which could be inferred from Graph 4).
Graph 4: Labour market-sensitive inflation
Non-labour inflation categories have been mixed over the past five years
The trends in the other inflation categories have not been as pronounced as that for labour-sensitive inflation. This in itself is a strong argument for this decomposition, as it allows us to more directly observe some of the competing forces that contribute to inflation outcomes. Some of the key results for these other categories are cited below.
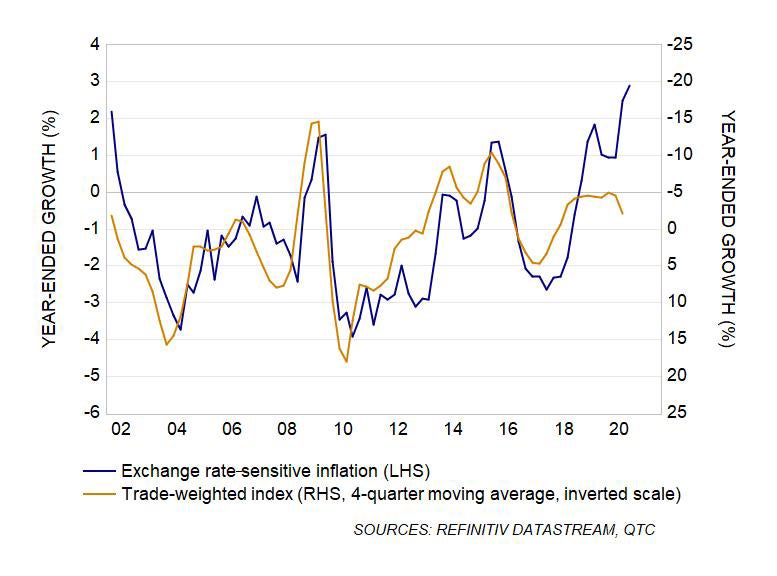
In contrast to labour-sensitive inflation, exchange rate-sensitive inflation has been above average in recent years (Graph 1). This pickup is larger than expected based on the depreciation of the exchange rate (Graph 5), with the strength possibly explained by disruptions to global supply chains.
Graph 5: Exchange rate-sensitive inflation
‘Acyclical’ inflation has been below average since 2019
Movements in persistent acyclical inflation are dominated by utility prices and tobacco. Utility price inflation has been relatively weak since early 2019, due to both a normalisation of prices following a surge in electricity and gas charges in 2017, as well as the effect of special rebates that were introduced in some states in response to the pandemic. This weakness has been partly offset by continued strong growth of tobacco prices.
Transient acyclical inflation includes various volatile and unrelated CPI components. This category explains the initial sharp decline in prices following the onset of the pandemic, due to the inclusion of both fuel and childcare prices.
Implications and outlook
The RBA has clearly stated its focus on achieving stronger labour market outcomes in the coming years. This emphasis is supported by our analysis, which suggests that weak headline inflation over the past five years has largely been underpinned by labour-sensitive CPI components.
While there is little doubt that a tighter labour market would contribute to higher inflation, the outlook for labour-sensitive inflation is far from clear. One source of uncertainty is the Non-Accelerating Inflation Rate of Unemployment (NAIRU), which is notoriously hard to pin down. Until recently, the RBA had estimated it was around four-and-a-half per cent. RBA Governor Lowe has since stated that it could be ‘in the low 4s’ and that it is ‘entirely possible’ that it is even below 4 per cent.[7] In other words, we may need to see the unemployment rate fall below 4 per cent before inflation is consistent with its target.
Achieving such low levels of unemployment could take some time, with the RBA not expecting inflation to be sustainably within the target band until ‘2024 at the earliest’. This timeline is supported by recent analysis available on the QTC website, where the baseline scenario estimates the cash rate will start to increase from late 2024 and an alternative scenario sees ‘lift off’ from 2026.