
Make (things in) America (so it can be) Great Again
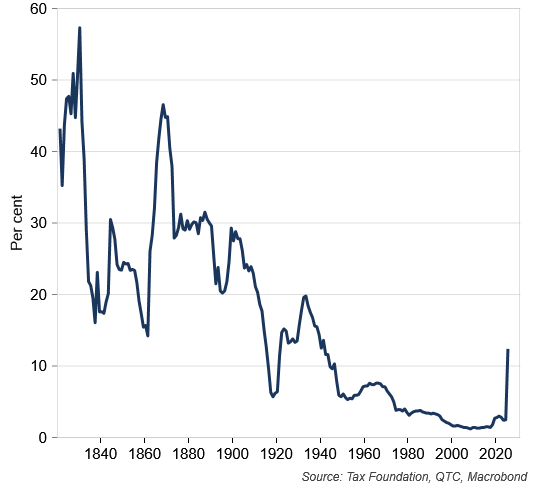
Early in his second term US President Donald Trump has prioritised trying to revive US manufacturing by increasing tariffs on goods imports from almost all countries around the world. Based on policies which had been announced by the Trump administration to 12 May 2025, including a de-escalation with China, the announcement of a trade deal with the UK and rebates for tariffs on inputs into auto production, Yale’s Budget Lab estimates the average effective tariff rate in the US will reach 16.4 per cent, the highest since 1937.[1] The Tax Foundation has a slightly lower estimate of 12.4 per cent, though even this would see the effective tariff rate reach its highest level since 1941 (Graph 1).
Graph 1 – US average import tariff rate set to reach the highest level in nearly 90 years
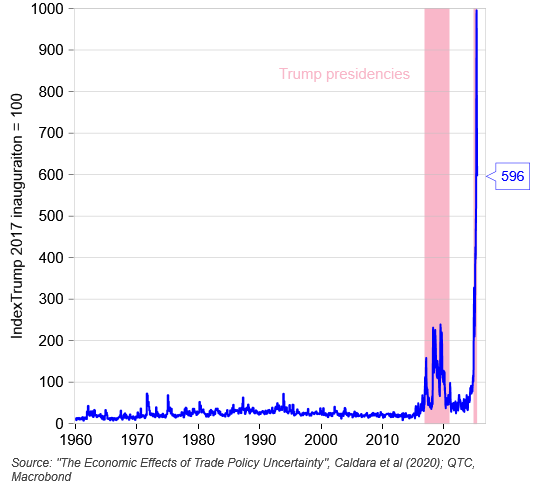
Tariffs imposed on imported goods will directly impact households in the US, the world’s biggest consumer market, while also affecting producers in economies that export to the US. In addition, the volatility and unpredictability of tariff announcements have seen a quadrupling of US trade policy uncertainty between President Trump’s inauguration and the recent peak on 30 April 2025 (Graph 2). Uncertainty usually has negative indirect effects on household spending as well as hiring and investment by businesses. This is likely to also be the case on this occasion, though it is hard to know to what degree. This is because some households and businesses might look through the uncertainty in the knowledge that in the current episode, escalations on tariffs have often been followed by de-escalations.
Graph 2 – US trade policy uncertainty soared to record highs
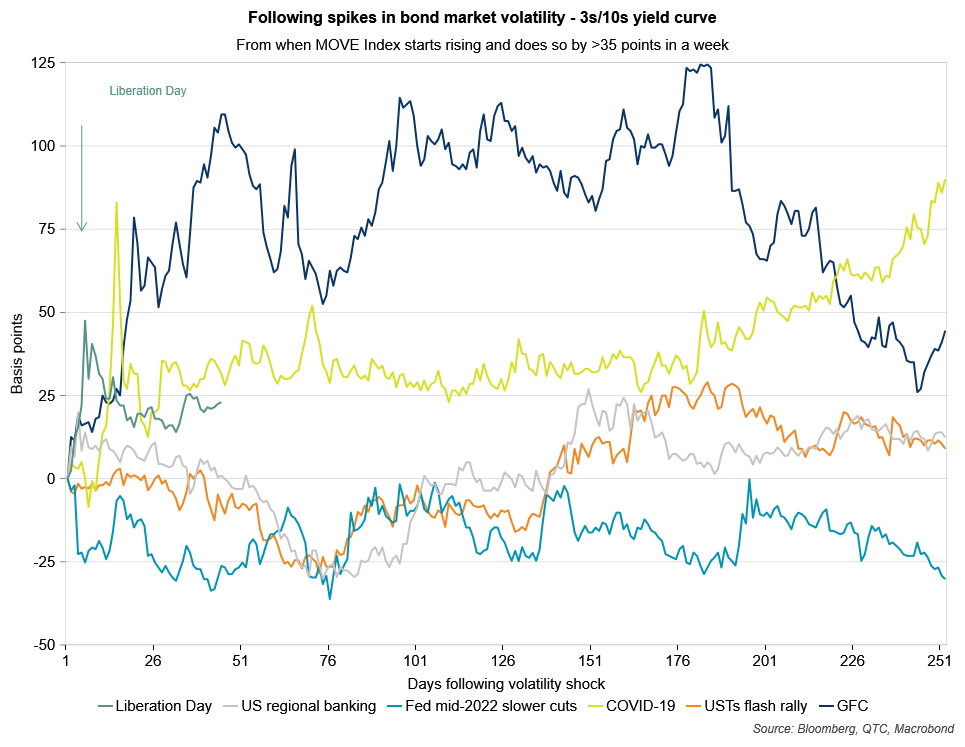
Higher tariffs will therefore have some sort of direct and indirect impacts on economic activity. Getting a sense of the magnitude of these has been challenging given the constantly evolving guidance around potential tariff levels. Financial markets also initially struggled to get a handle on how tariffs might shift not only the baseline expectations for economic growth but also the distribution of risks around this central projection. Indeed, in the period immediately following the “Liberation Day” announcement of “reciprocal” tariffs on 2 April 2025, many financial market prices were moving by more than during other periods of elevated (bond) market volatility since the Global Financial Crisis (GFC) (inclusive). This can be seen in Graphs 3, 4 and 5 which illustrate the movement of the Australian Government bond yield curve, the Australian Dollar, and US equities respectively. These charts also reveal how quickly markets reversed course after a 90-day pause was put in place for the “reciprocal” tariffs.
Graph 3 – The yield curve steepened after announcement of “reciprocal” tariffs…
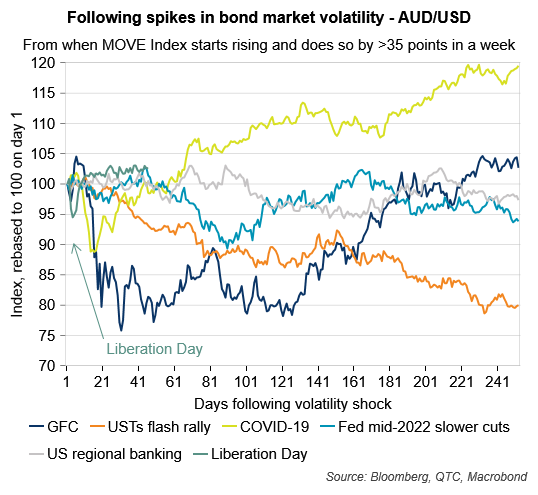
Graph 4 – while the Australian Dollar fell…
Note: The MOVE Index refers to the expectations for future movements in bond prices and is calculated using options on US Treasury bonds
Graph 5 – …as did US stocks
The challenges that market participants faced in forming expectations around the outlook for economic growth through this period suggest that it is worthwhile to collect and present different perspectives on how these changed during this period of trade policy uncertainty.
Expecting the worst and hoping for the best
There have been notable revisions to global and US forecasts through the recent period of trade policy uncertainty, though those for Australia have been less pronounced. These findings are discussed below.
Global
In the April 2025 update of the World Economic Outlook (WEO), the International Monetary Fund (IMF) downgraded its 2025 global real GDP growth by half a percentage point to 2.8 per cent.[2] Private sector forecasters surveyed by Bloomberg made a slightly smaller adjustment (3.00 per cent to 2.65 per cent) over the identical six-month period (Graph 6).
Graph 6 – Private sector forecasters have marked down expectations for global real GDP growth
Source: Bloomberg
US
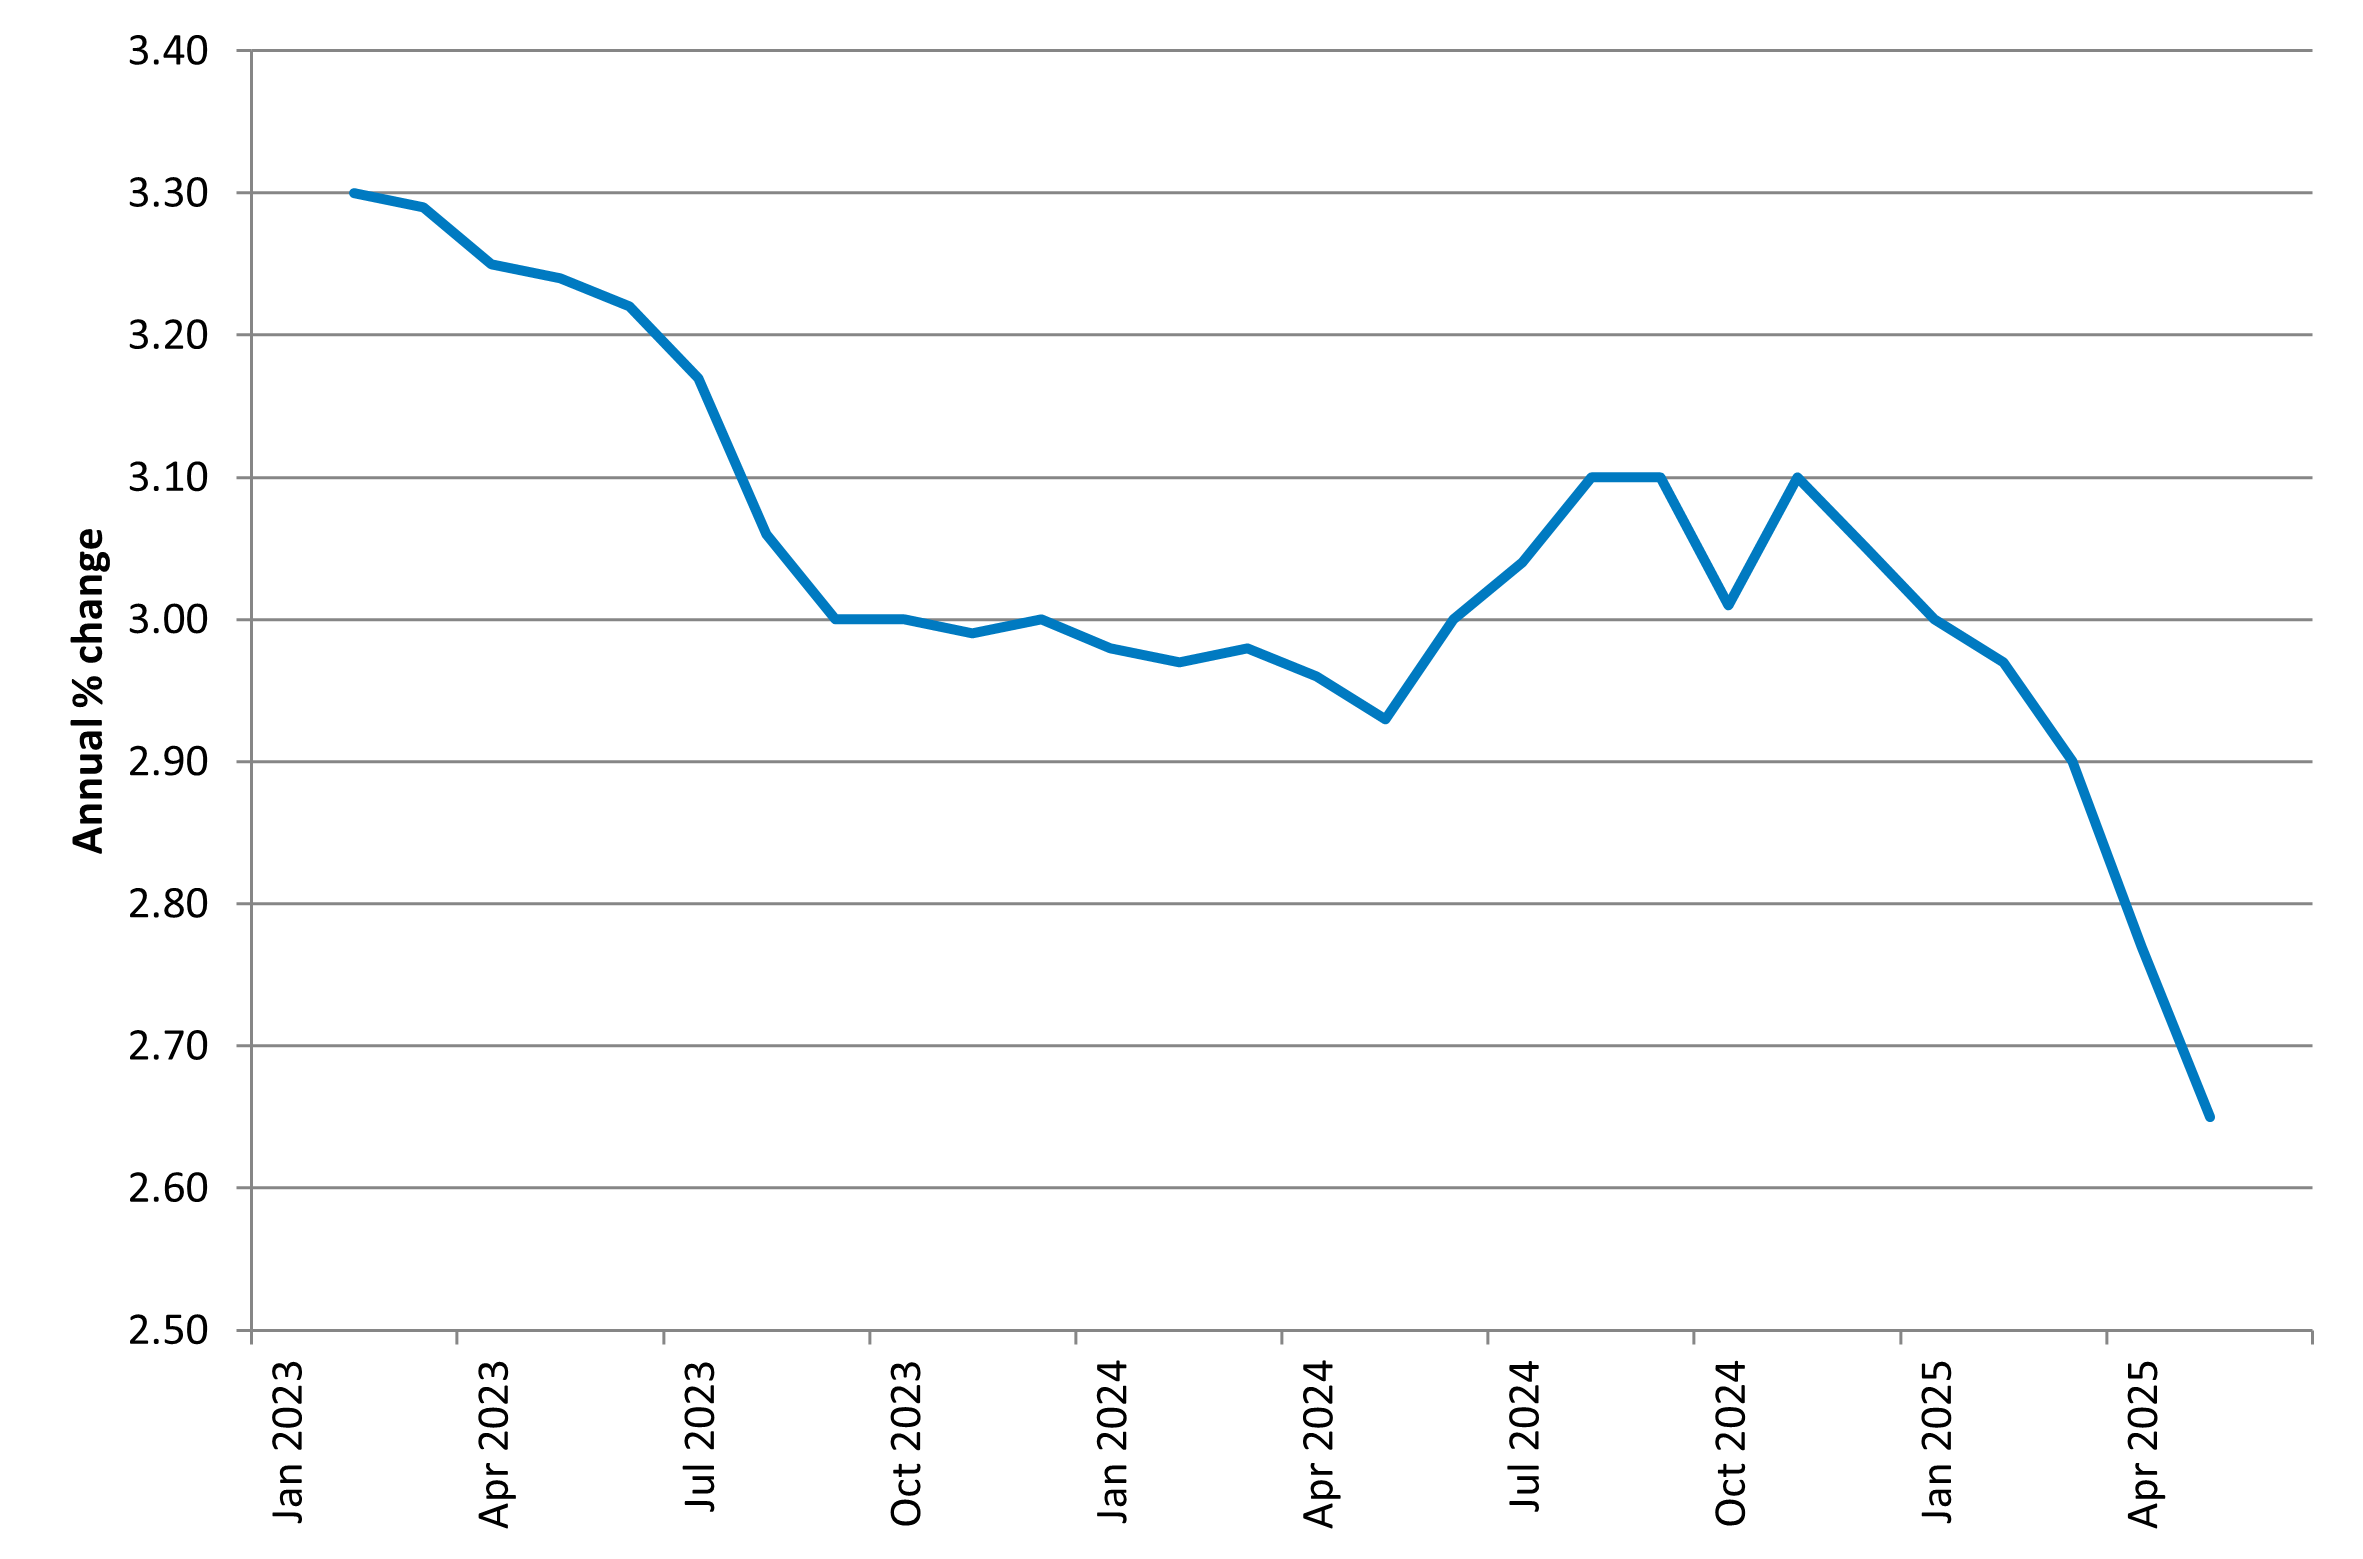
For the US, private sector economists have also marked down their outlook for the economic growth in 2025 given the prospect of higher tariffs (Graph 7). The consensus of economists surveyed by Bloomberg now expect it to be around 1.4 per cent versus approximately 1.9 per cent prior to Liberation Day. Between October 2024 and April 2025, the IMF marked down its US real GDP growth estimates for 2025 by 0.9 percentage point, from 2.7 per cent to 1.8 per cent.
Graph 7 – Private sector economist forecasts for US economic growth for 2025 have been lowered
Source: Bloomberg
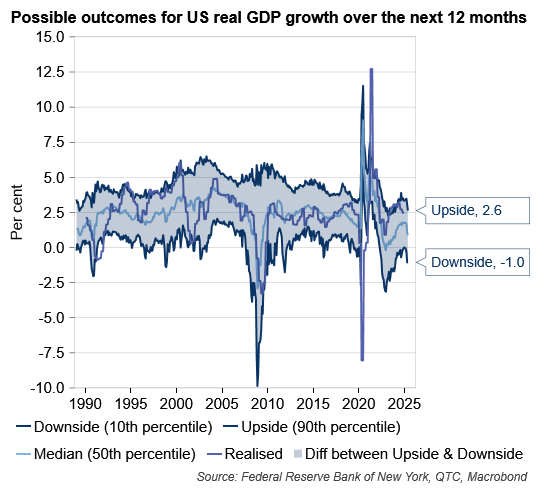
Economic growth forecasts being marked lower is consistent with analysis from economists at the New York Federal Reserve which highlights that possible growth outcomes in either an upside or downside scenario have also gotten worse in recent months. For instance, Graph 8 shows estimates of the distribution of US real GDP growth outcomes in one years’ time (conditioned on the level of financial conditions in the economy). In March 2025, prior to Liberation Day, the New York Fed economists estimated a 10 per cent probability that real GDP growth in a year would be equal to or more than 3.5 per cent and a 10 per cent probability of it being equal to or less than 0.3 per cent. By May 2025, these upside and downside scenarios for growth had been revised down to 2.6 per cent and -1.0 per cent respectively.
Graph 8 – Downside risks to US economic growth have been building
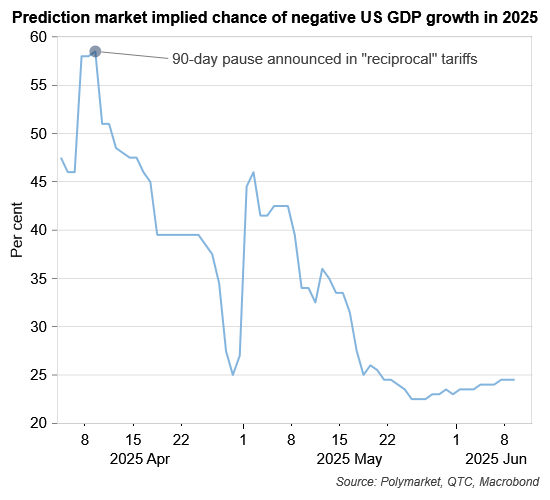
Building downside risks has also been evident in prediction markets[3] which, just prior to the 90-day pause on the “reciprocal” tariffs, had factored in a nearly 60 per cent chance of the US experiencing negative annual real GDP growth in 2025. Since then, the possibility of this occurring has fallen back to around 25 per cent (Graph 9). This speaks to confidence building in the economic outlook with it being assessed that there is a higher likelihood of less severe tariff increases.
Graph 9 – Prediction markets have significantly revised down earlier expectations of a US recession
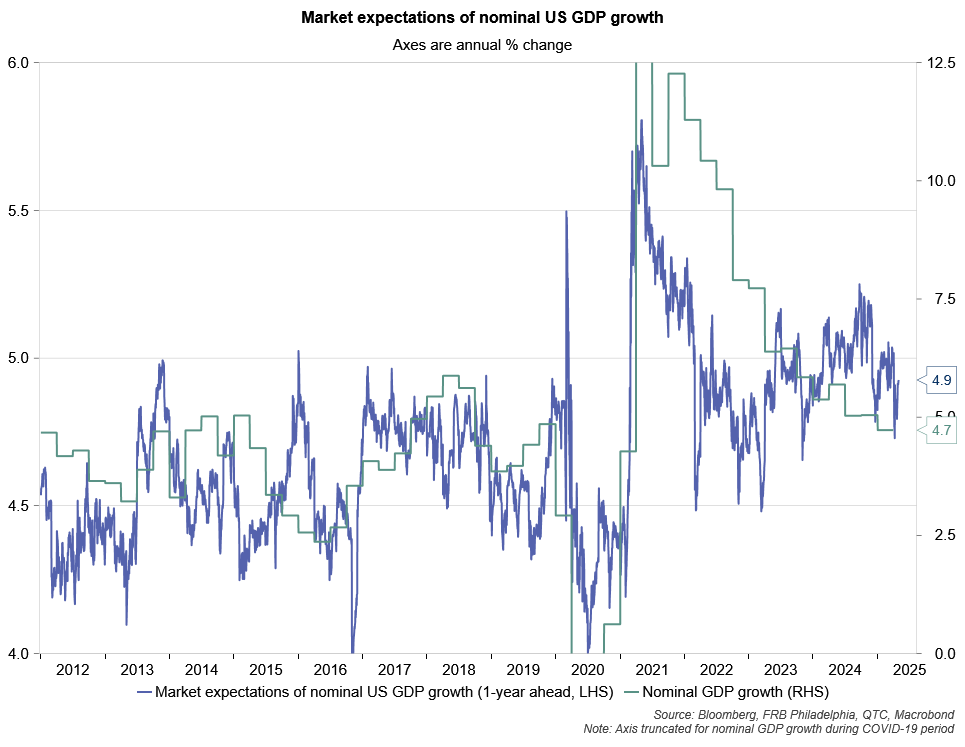
Finally, given that investors are forward looking, it is possible to derive economic growth expectations from financial market prices. It is however a complicated task given how much information is contained in market prices. As such, these should only be considered an approximation of expected economic growth. Based on the approaches used (see technical appendix), there appears to be some correlation between market-implied expectations for nominal GDP growth and actual growth (Graph 10). This, coupled with the possibility of updates at a higher frequency than economist forecasts, suggests that there could be value in trying to estimate growth expectations from a market point of view.
Graph 10 – Correlation between actual US economic growth and market derived expectations
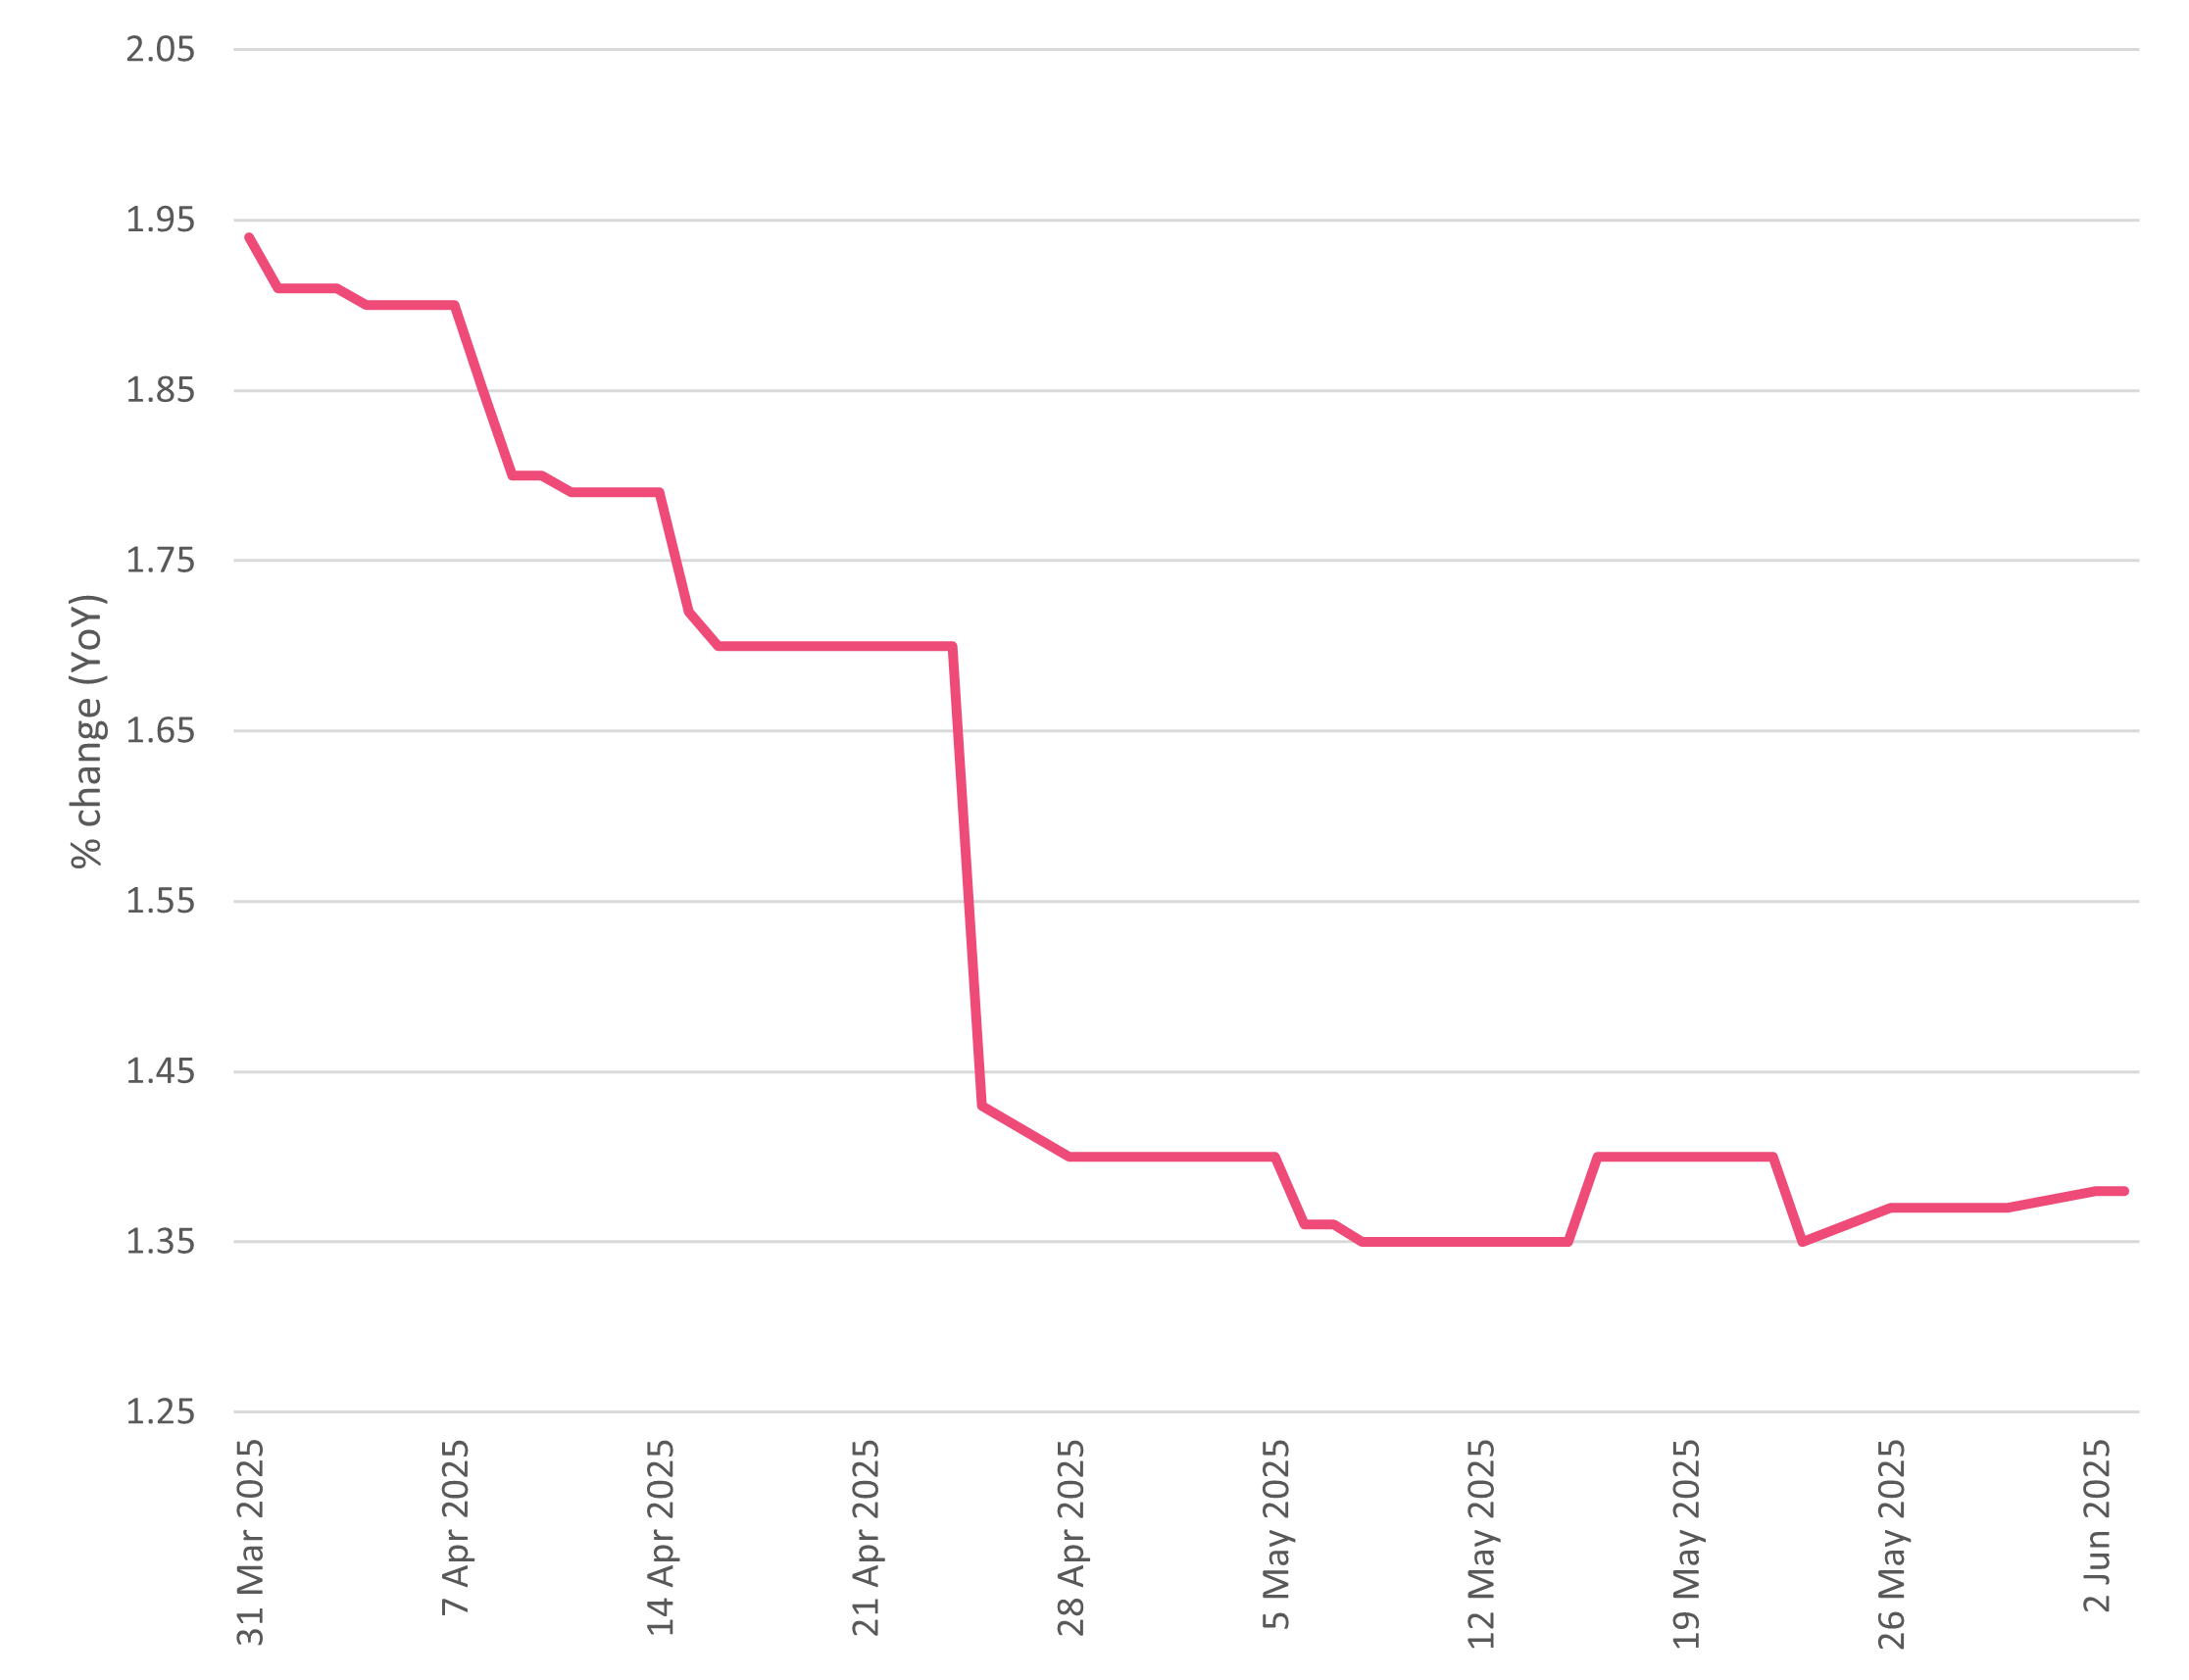
Focussing just on the most recent period (Graph 11), the impact on economic growth expectations from the announcement of the “reciprocal” tariffs is clear, as is the rebound a few days later when the implementation of these was paused for a period of 90 days.
Graph 11 – Market-based expectations for US growth fell in the wake of the tariff announcement, only to rebound after these were paused
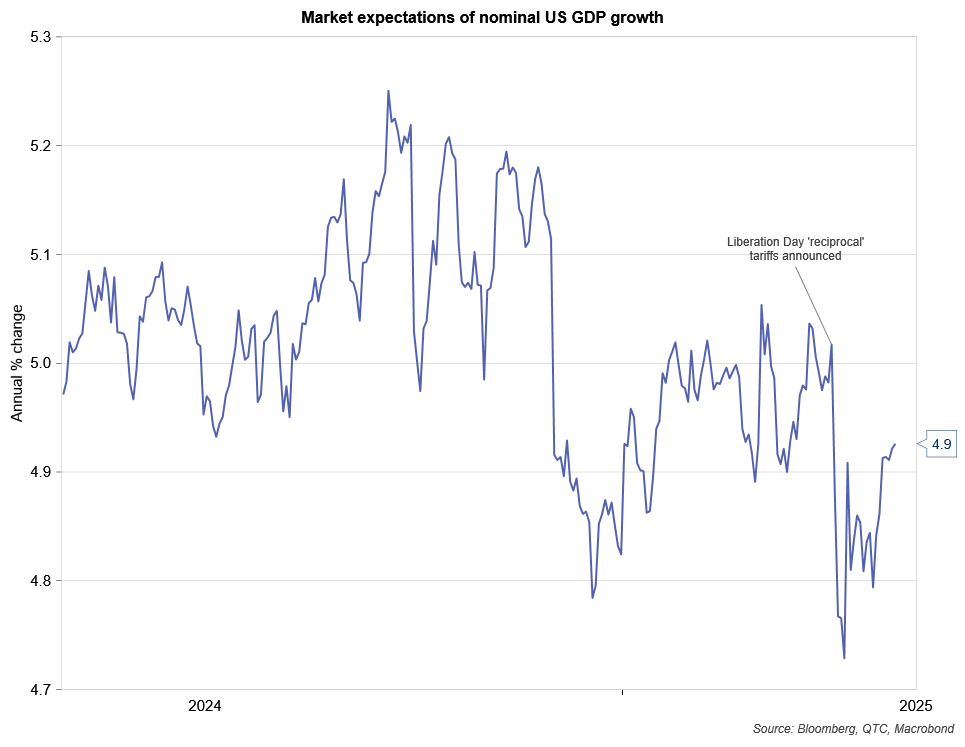
Interestingly, these recent movements are not materially different to the sort of variation that is typically evident. In a general sense, this highlights that markets can be a volatile source from which to derive forecasts of the economy (this is also apparent in market-based measures of inflation expectations). There are also several possible interpretations for this in the current context. It could be that investors have struggled to identify scenarios for the economy and assign probabilities to these amid all the trade policy uncertainty. It could also be that investors didn’t revise their growth expectations given the volatility, because they were anticipating that the level of tariffs may ultimately be reduced.
Australia
Most local economists appear of the view that current US tariff policy settings would likely have limited direct effects on Australia, though possibly more significant indirect effects via our trade relationship with China. Reflecting this, since mid-March 2025, private sector economists surveyed by Bloomberg have lowered estimates for Australian real GDP growth from 2.2 per cent to 1.9 per cent. The RBA made similar changes between its February and May 2025 editions of the Statement on Monetary Policy with forecasts for 2025 real GDP growth being lowered from 2.4 per cent to 2.1 per cent respectively. Finally, between October 2024 and April 2025, the IMF downgraded forecasts for Australian real GDP growth by half a percentage point to 1.6 per cent in the WEO.
Alternate estimates of economic growth in Australia beyond those available from private sector economists or official institutions are not available given there are no prediction markets like in the US and there is a lack of published data series of the type that would be needed to construct market-based expectations for economic growth.
How economic conditions are tracking at present
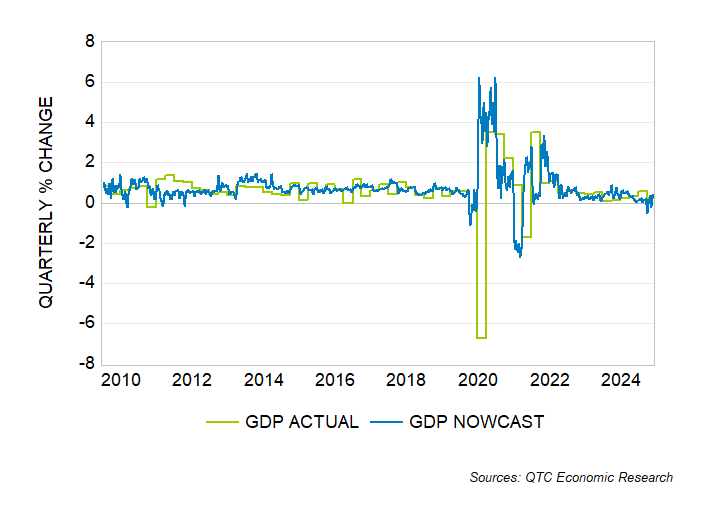
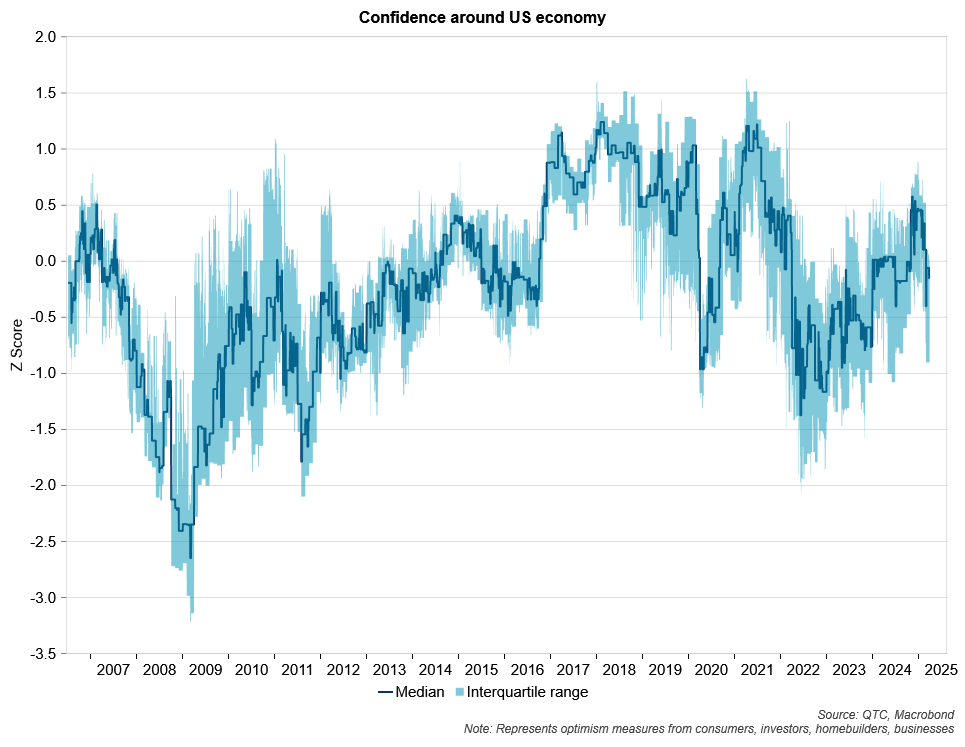
Expectations for economic growth have improved in the US according to prediction markets and market-based measures. This is consistent with resilience in high frequency daily ‘nowcasts’ of current period growth in the US (middle pane, Graph 12). Nowcasts of global (top pane) and Australian (bottom pane) real GDP growth are also holding up at this stage. This suggests that, at least so far, material adverse impacts from US trade policy uncertainty are not materialising in ‘hard data’. This contrasts with ‘soft data’, such as those from surveys, which has shown a decline in confidence amongst different agents within the US economy (Graph 13), albeit one which to-date is more benign than in other notable instances of decline.
Graph 12 – Economic growth still holding up despite trade policy volatility
Global
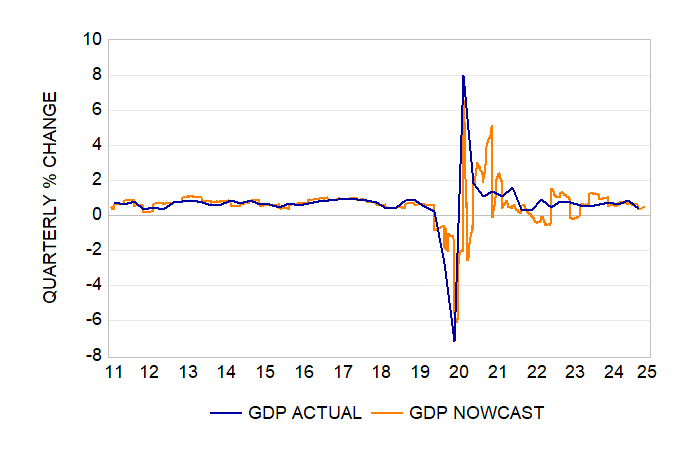
US
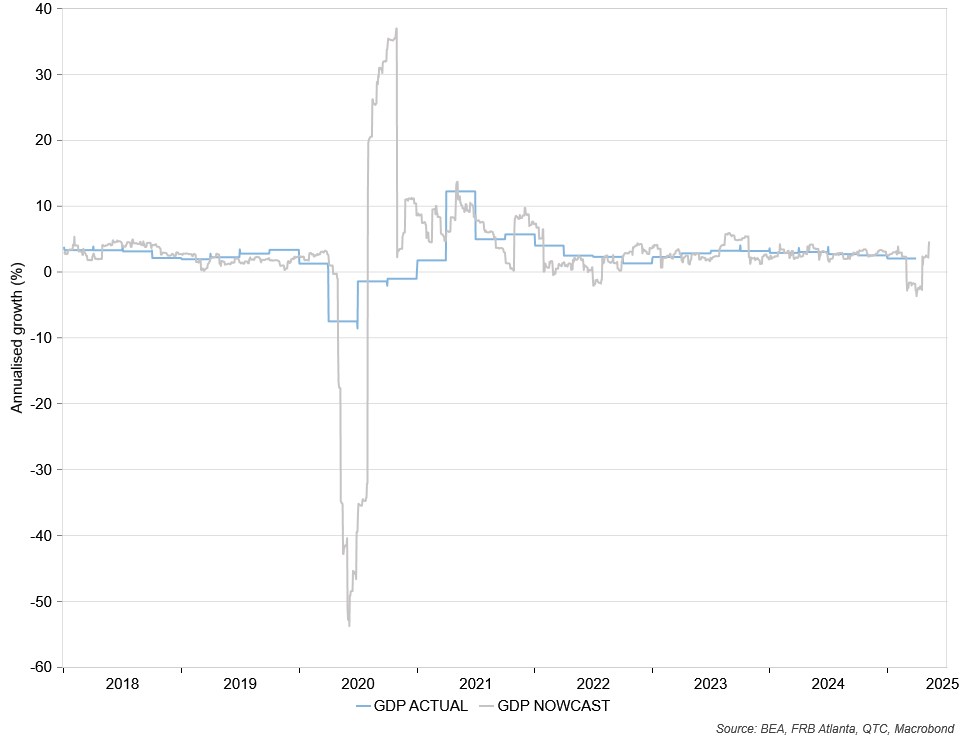
Australia
Graph 13 – Confidence in the US economy has declined
Conclusion
RBA Governor Michelle Bullock has described US trade policy as ‘a complete roller coaster’. The constant movement in proposed tariff levels have made it difficult to get a clear sense of what the economic outlook is. This was part of the reason why financial market conditions were so volatile immediately following the announcement of “reciprocal” tariffs. Real GDP growth forecasts updated over this period have generally been revised lower for the global, US and Australian economies. For the US, where estimates are available at a higher frequency via financial and prediction market derived measures, there is some tentative evidence that growth expectations have stabilised and begun to improve. This trend should be expected to continue if US trade policy settings were to remain as they have been in the very most recent period, and that is, stable.
Footnotes:
[1] This estimate assumes households shift consumption patterns in response to higher prices.
[2] Note, these forecasts were prepared after the 90-day pause on the Liberation Day tariffs were announced but before the de-escalation between the US and China saw bilateral tariff rates between the two countries decline substantially.
[3] Prediction markets are online based platforms where individuals can take positions in contracts specifying the outcome of a future unknown event. These could include political, geopolitical, economic, financial, cultural, sporting or weather events.