
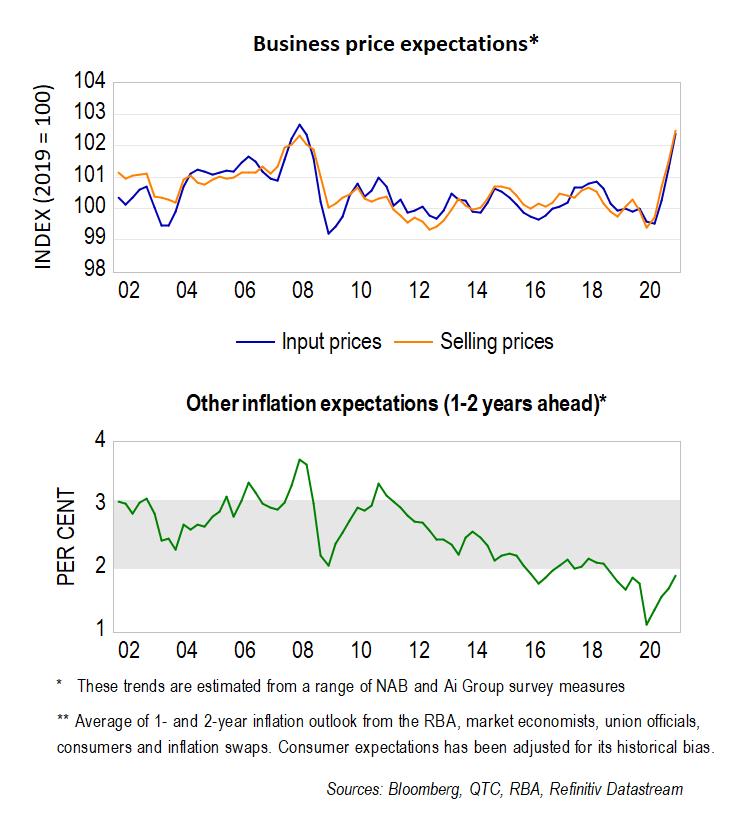
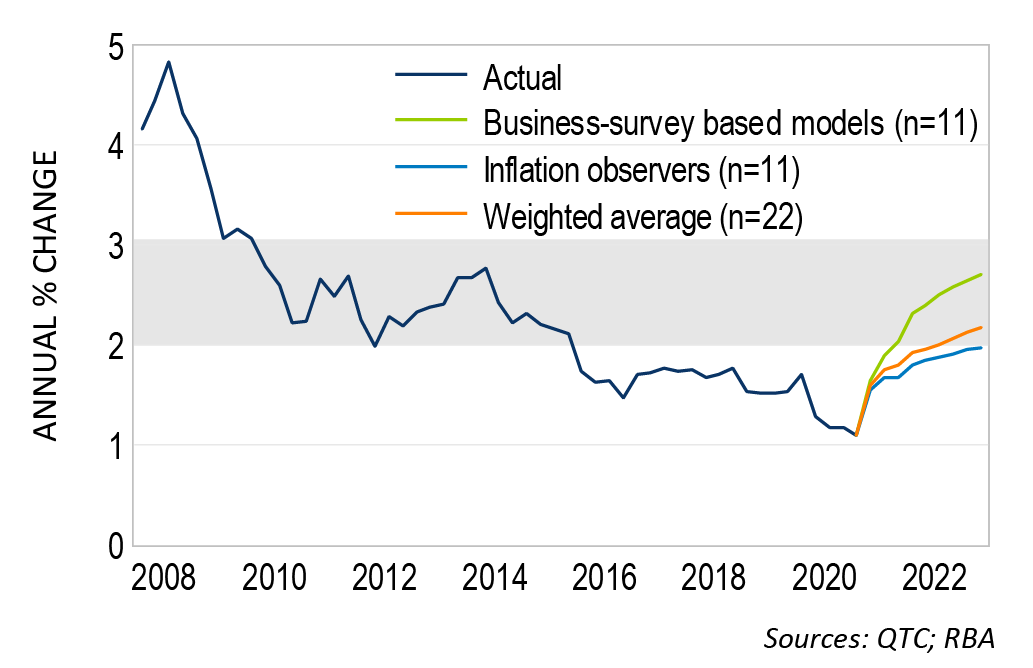
Business inflation expectations have increased to their highest level since 2008, underpinned by a robust recovery of demand and constrained supply conditions (Graph 1). However, other measures of expected inflation have experienced more modest gains. In this note I gauge how much weight we should put on these different signals by assessing the historical forecast accuracy of various measures of inflation expectations. I find that while business expectations perform reasonably well for short-term horizons, this is not always the case over longer periods. To reduce the risk of relying on any single measure, I have calculated a weighted average of the different forecasts. The results suggest that inflation could reach the bottom of the RBA’s target band in the second half of 2022, which is slightly earlier than the RBA’s current forecasts.
Graph 1: Measures of inflation expectations
Recent inflation trends
Recent increases in inflation expectations have been underpinned by developments on both the demand and supply sides of the economy. For demand, the recovery has unfolded rapidly on the back of an easing of lockdowns and substantial support from fiscal and monetary policies. On the supply side, disruptions to global supply chains and a lack of foreign workers1 have acted as constraints.
The impact of these developments is evident in the labour market. The unemployment rate returned to its pre-pandemic level in May, while the underemployment rate (which has a stronger relationship with inflation)2 is at its lowest level since 2014. Other measures paint a similar picture. For example, the share of firms reporting labour availability as a constraint on output is at its highest level since the mining investment boom.
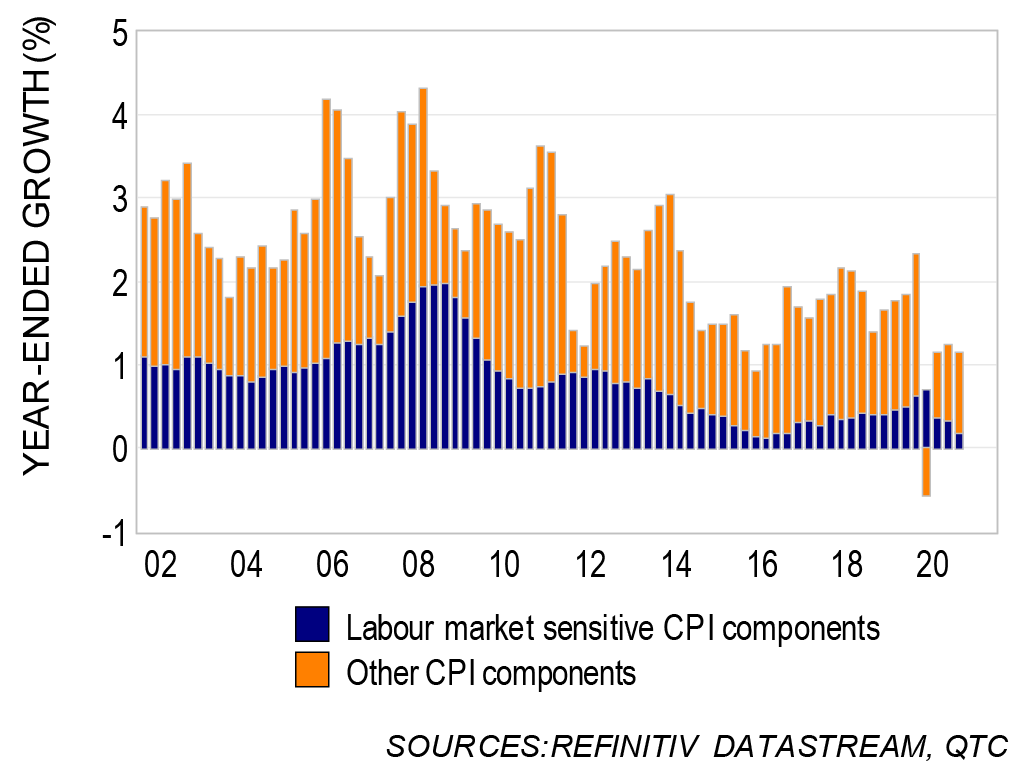
The tightening of the labour market is important if there is to be a sustained increase in inflation, with labour market slack having underpinned much of the weakness in price growth since 2015 (Graph 2).3 Nonetheless, the timing and extent of any increase in inflation is unclear. As noted by RBA Governor Lowe, ‘there are a range of factors that are contributing to limited upward pressure on wages [and inflation], even in tight labour markets.’4
Graph 2: Contribution to headline inflation
Inflation expectations
Given this uncertainty around the timing and extent of any pick-up in price growth, I have assessed the information provided in a range of different inflation expectation measures.
The business surveys are of interest given the strong signals about future inflation they are providing at present (Graph 1). These surveys are focused on short-term price outcomes, providing a timely read on current inflation and the outlook for the next three months. As such, the sharp increases in recent months suggest that headline inflation and producer prices will be elevated in the next quarter or two.
One question is whether these recent price increases are likely to be transitory or if they will lead to a more persistent rise in inflation?5 While the business surveys may shed some light on this issue, there is a range of other indicators that provide a more direct read of the medium-term inflation outlook. These include expectations of consumers, as well as forecasts from the RBA and market economists, the survey of union officials, and financial market-based measures such as inflation swaps.6
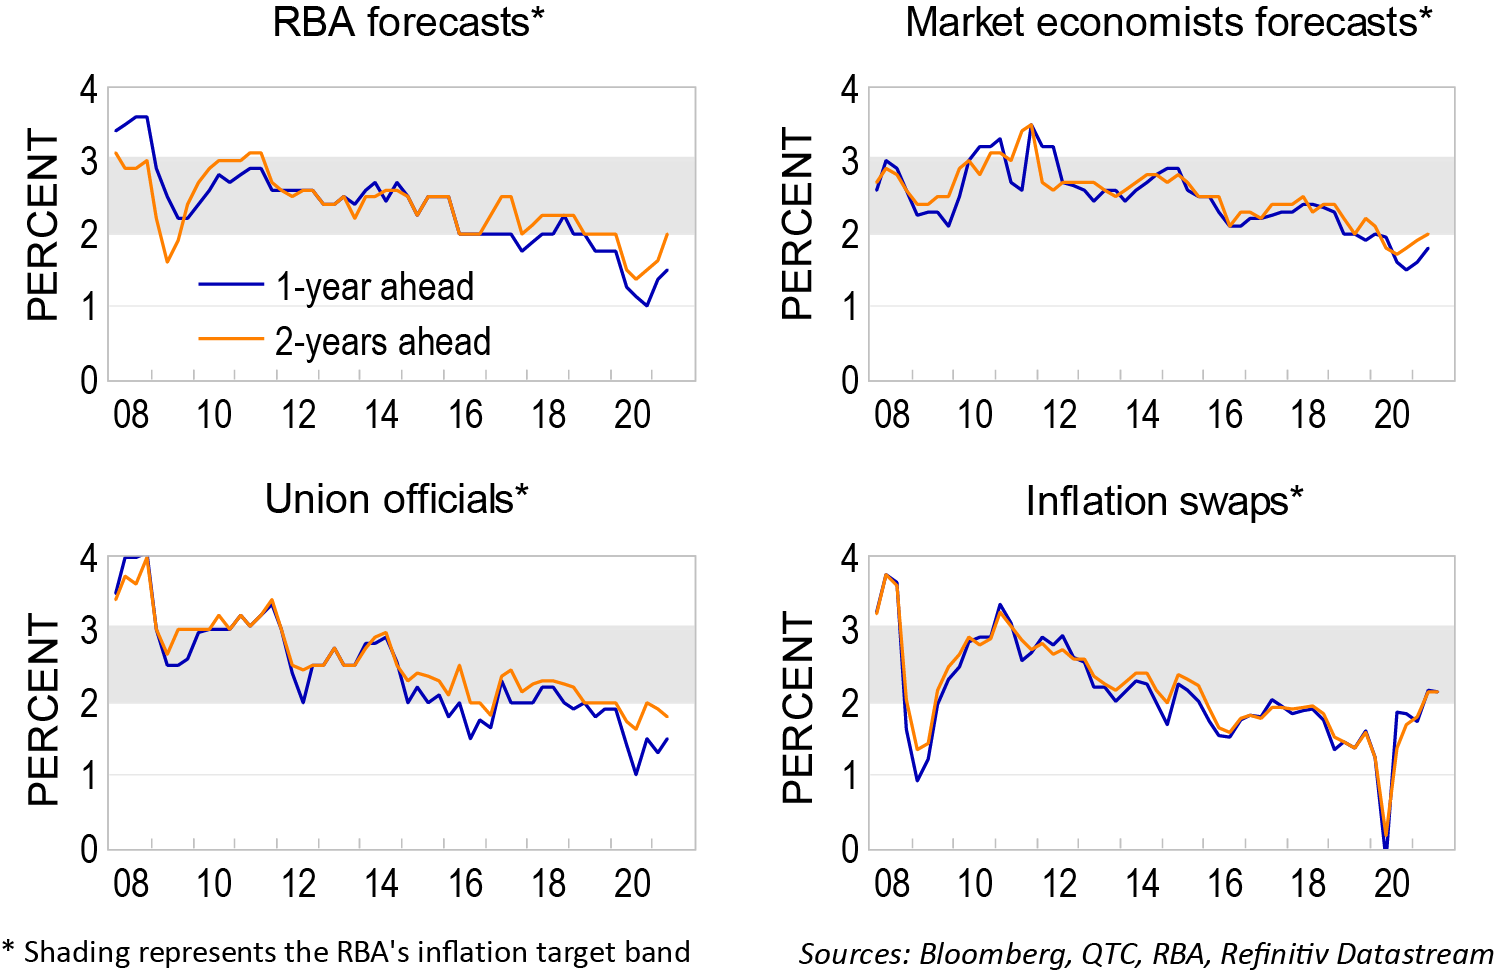
The medium-term expectations of this latter group of ‘inflation observers’ (that is, those apart from businesses and consumers) are set out in Graph 3. These indicators suggest inflation will pick-up over the next couple of years, reaching the bottom of the RBA’s target band by mid-2023.7 However, the increase is more modest than implied by business inflation expectations, suggesting much of the strength in the business surveys is expected to be transitory.
Graph 3: Medium-term inflation expectations
Learnings from the past
I have assessed the historical accuracy of various measures of inflation expectations to gauge how much weight we should put on these different signals.8 My results suggest that while business inflation expectations perform reasonably well for one-quarter ahead forecasts (by design), the other measures perform noticeably better over longer horizons.
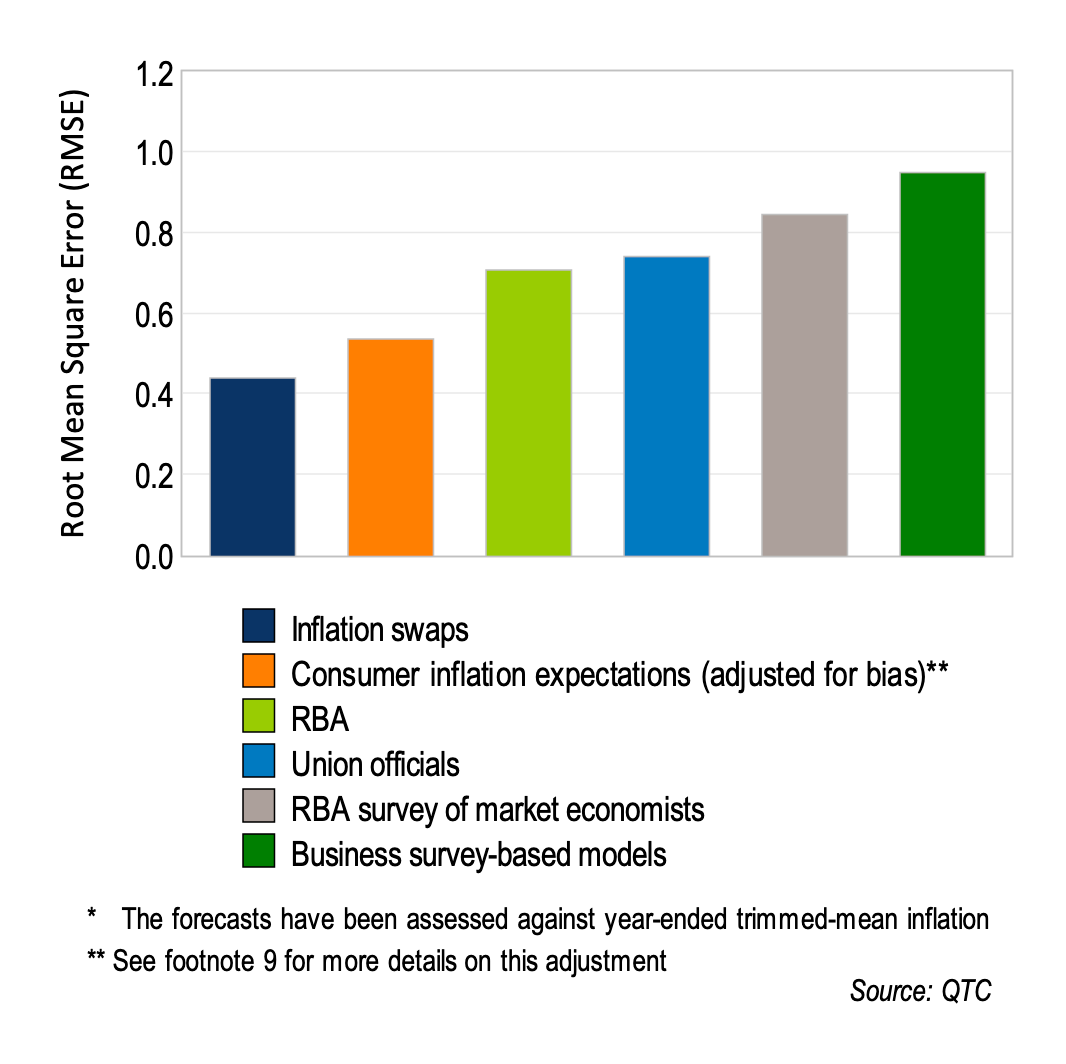
Since 2014, the most accurate indicator of inflation two-years ahead has been inflation swaps, with forecast errors less than half of those from the business survey measures (Graph 4). ANZ-Roy Morgan’s consumer inflation expectations have also provided a relatively accurate outlook for inflation, though the level of the series needs to be adjusted for a persistent bias.9 Inflation swaps currently suggest that inflation will reach 2.1 per cent by mid-2023, while the bias-adjusted measure of consumer inflation expectations has the lowest expectation across all indicators at 1.4 per cent.
Graph 4: Historical forecast errors (2-years ahead, 2014Q1 – 2021Q1)*
The finding that business inflation expectations are better suited for short-term forecasts appears to be robust over time. However, the relative performance of the other inflation expectations measures can be sensitive to the sample period. Noticeably, there is little evidence of two-year inflation swaps outperforming the RBA or market economists prior to 2015. The gap between the RBA and market economist forecast errors is also smaller for different sample periods. 10
Looking to the future
To assess the path for inflation over the coming years, I have constructed a range of forecasts using different measures of inflation expectations. I then calculated a weighted average of these forecasts based on each indicator’s historical forecast accuracy (see appendix for technical details).
The results are shown in Graph 5 and discussed below.
- Aggregate: Inflation is expected to bounce higher in the June quarter before it resumes a more gradual recovery. Trimmed-mean inflation is forecast to reach the bottom of the RBA target band in the second half of 2022 and is slightly above two per cent by the middle of 2023. Over most horizons, this aggregate puts noticeably more weight on the inflation observers than it does on the business surveys. 11
- Inflation observers: These measures show a more modest rise relative to business expectations, with inflation reaching two per cent by June quarter 2023. This increase is consistent with previous estimates I produced using a modified version of the RBA’s MARTIN model (see ‘Re-assessing Australia’s economic recovery’).
- Business surveys: These forecasts assume that the current high level of business inflation expectations is maintained (ie, the current inflation pressures become persistent). This scenario sees inflation pick-up rapidly, reaching the middle of the RBA’s target band in the second half of next year.
Graph 5: Underlying inflation measures
Implications
The rise in business inflation expectations is a strong signal that there will be some short-term price pressures. However, these indicators are not designed to provide a signal of price pressures beyond the coming three months. While it is possible that the unique demand and supply balance faced at present could persist and be more acute than it has been in the past, the measures with the greatest historical forecast accuracy suggest that much of this strength is likely to be transitory. Overall, these results suggest that inflation is likely to reach the bottom of the RBA’s target band in the second half of 2022 and be slightly above two per cent by the middle of 2023.