
Australia’s economic recovery has outperformed expectations
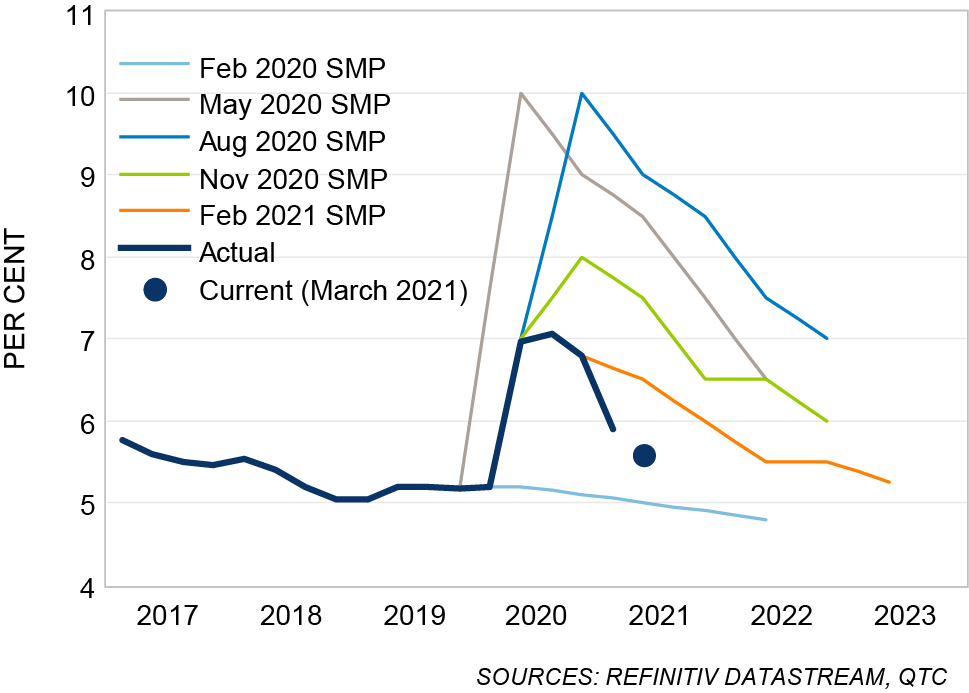
The recovery has been stronger-than-expected across many segments of the global and domestic economy. The bounce back of labour markets has been particularly striking, with successive downward revisions to the unemployment rate forecasts provided by central banks and the private sector. For example, in its August 2020 Statement on Monetary Policy, the RBA was forecasting Australia’s unemployment rate to be 10 per cent in the December quarter. Instead, it ended up being 6.8 per cent, more than three percentage points below expectations. Similarly, the unemployment rate fell to 5.6 per cent in March this year, which is almost one percentage point below the RBA’s current estimate for the June quarter (a forecast itself that has been revised considerably lower over time).
Graph 1: RBA Unemployment Rate Forecasts
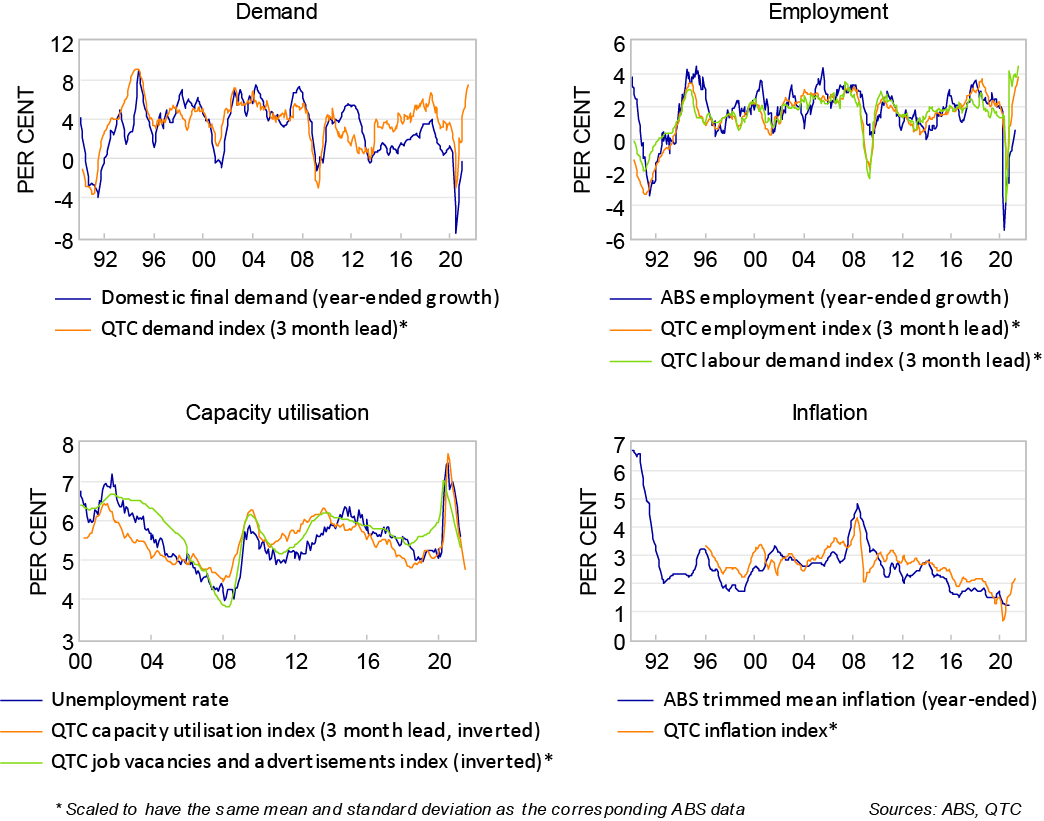
The RBA is likely to revise its forecasts further when its May Statement on Monetary Policy is released next Friday, 7 May 2021. This reflects the better-than-expected outcomes to date, as well as the prospects that this could continue in the coming months. This is evident in several of the indicators we have developed at QTC.[2] For example, those in Graph 2 provide readings on demand, employment, spare capacity and inflation[3] and have been fairly consistent with ‘official’ measures of these series throughout the recession and recovery. Furthermore, these are leading indicators and give a sense of how economic activity could evolve in the very near term. At present they suggest that the momentum observed recently could continue.
Graph 2: Leading Indicators for the Economy
Outlook
I have used a modified version of the RBA’s model – MARTIN – to assess the possible implications of this recent strength for the longer-term economic outlook. To do this, I first calibrated MARTIN’s estimates for the March and June quarter to ‘nowcasts’ that I put together based on a range of leading indicators. I then used MARTIN to construct three scenarios for the longer-term outlook, based on different assumptions for the timing of cash rate increases.
- Scenario 1 – ‘Pre-emptive’: The RBA starts to increase the cash rate as soon as inflation reaches the bottom of the target band.
- Scenario 2 – ‘Cautious’: The RBA waits for inflation to be within the target band for one year before it starts to increase rates.
- Scenario 3 – ‘Delayed’: The RBA waits for inflation to be within the target band for two years before tightening monetary policy.
These assumptions have been used to assess the sensitivity of the outlook to the timing of cash rate increases. The RBA’s actual decision on when to increase the cash rate will be based on many different factors and cannot be replicated in a simple rule. Similarly, MARTIN’s projections may not correspond to those in the RBA’s May Statement on Monetary Policy, as this model is just one input into the RBA’s forecasting process. Still, this exercise provides a useful starting point to think about the upcoming Statement on Monetary Policy.
Medium-term outlook (2021 – 2024)
The projections are largely the same across the different scenarios through to the end of 2024. Economic conditions are expected to improve noticeably over this period, due to both continued low interest rates and the current momentum in the economy (Graph 3).
Graph 3: RBA Cash Rate Scenarios
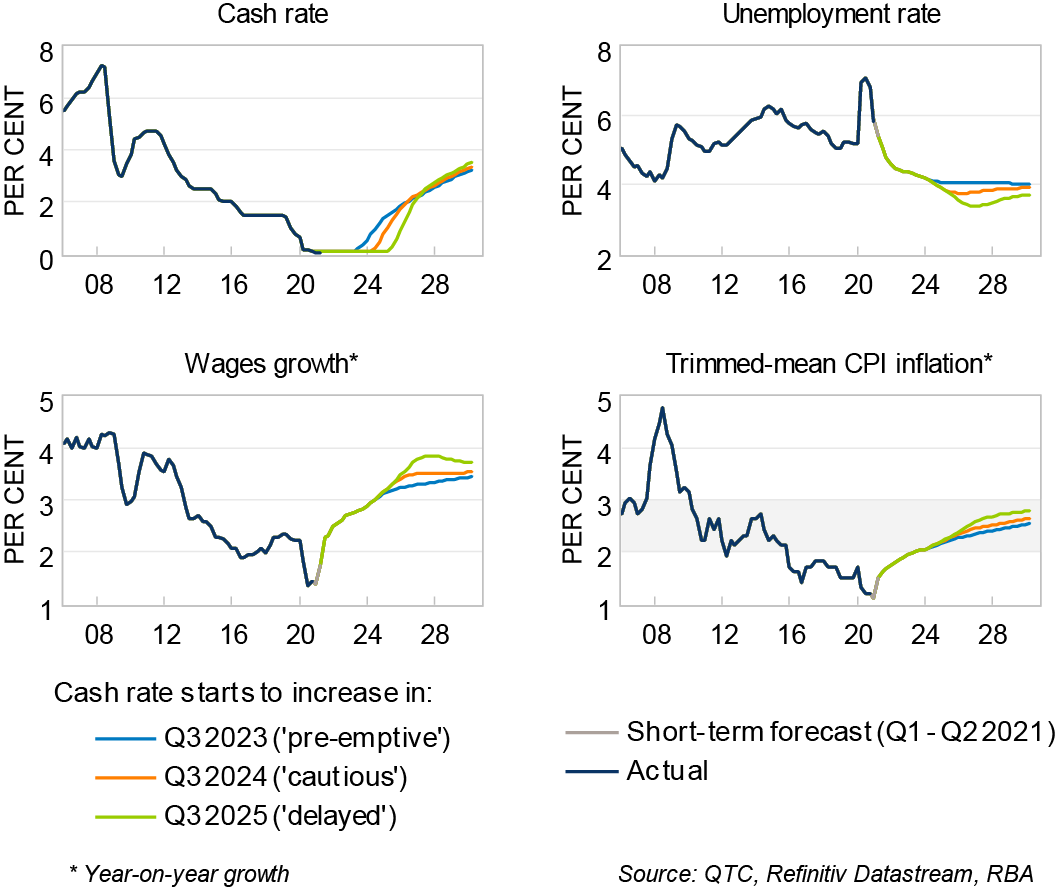
- The unemployment rate is projected to decline to 5.4 per cent in the June quarter and be under five per cent by the end of this year. The pace of the improvement slows slightly from this point, with it falling to around four per cent by the end of 2024.
- Wage growth increases noticeably due to tighter labour market conditions, higher inflation expectations, and a period of catch up following weak wage outcomes in 2020. It is projected to increase to over three per cent by the end of 2024, which would be its highest level since 2013.
- Trimmed-mean CPI inflation hovers slightly below the target band through to June quarter 2023, then remains at the bottom of the target band through to the end of 2024.
Long-term outlook (2025 – 2030)
The projections start to diverge from around 2025 in response to the different cash rate paths.
- The unemployment rate settles at four per cent in the ‘pre-emptive’ scenario, while the additional stimulus from leaving policy unchanged until 2025 (‘delayed’ scenario) would see the unemployment rate fall to 3½ per cent. This is consistent with the RBA’s assessment that an unemployment rate ‘in the low 4s’ may be required for inflation to return to its target, and that it is ‘entirely possible’ that it may need to fall below 4 per cent.[4]
- Wage growth increases further in response to tight labour market conditions, with the ‘delayed’ scenario seeing nominal wage growth reaching its highest level since the peak of the mining boom. The increases in wages outpace CPI inflation, with real wage growth ranging from 1 to 1.2 per cent across the different scenarios.[5]
- Trimmed-mean inflation reaches the middle of the target band in 2026 in the ‘delayed’ scenario, in 2027 in the ‘cautious’ scenario, and in 2028 in the ‘pre-emptive’ scenario. Nonetheless, the range of inflation outcomes across the scenarios is narrow, with the difference between inflation forecasts from the ‘delayed’ and ‘pre-emptive’ scenarios peaking at around a quarter of a percentage point.[6]
Discussion
RBA Governor Lowe has reinforced that he does not expect the Board to start increasing the cash rate until ‘2024 at the earliest’. Taken at face value, my results are supportive of these comments, with the RBA’s guidance appearing to be consistent with it achieving its inflation target over the medium term.
However, there are some caveats around these results:
- The results do not account for any possible introduction of macroprudential policies in response to conditions in the housing market (ie, a possible deterioration of lending standards). If this were to occur, it is possible the RBA would try to stimulate other parts of the economy to offset the effects of weaker housing conditions, leaving the cash rate lower for longer.
- The model I used – MARTIN – is focused on estimating the demand-side of the economy rather than supply. Given the relatively long horizon of the forecasts, it is possible that various supply-side developments could lead to higher inflation over the forecast period (eg, widespread re-shoring of industries).
Despite these caveats, models such as MARTIN provide a useful and consistent framework for assessing how the economic recovery could evolve over the coming years. They also allow us to easily test the sensitivity of the outlook to different assumptions, which is particularly important during periods of heightened uncertainty and rapid change.