
2030 Vision: Outlook for the economy and interest rates
Despite a swift rebound in economic activity, the Australian economy continues to face challenging conditions and the path forward remains uncertain. These exceptional circumstances require us to consider how the economic recovery could play out, not only over the next couple of years, but also over the long term. With the time horizons of most published forecasts too short to make a fulsome assessment of the outlook, I ran some scenarios to see what things might look like through to 2030.
In scenario 1 I used a modified version of the RBA’s large-scale model of the Australian economy – MARTIN1 – and projected the Bank’s forecasts through to the end of 2030. I also used MARTIN to test two other scenarios, where the RBA responds only to its inflation objective (scenario 2) and where there is no lower bound on the cash rate (scenario 3).
The results from these long-term projections lend support to the notion that interest rates could remain lower for (a lot) longer.
Scenario 1: Projecting the cash rate beyond the RBA’s forecast horizon (baseline projections)
The RBA’s February Statement on Monetary Policy presented forecasts to the middle of 2023. To look beyond this, I calibrated MARTIN’s estimates so that they match the RBA’s official forecasts. I then extended these forecasts by estimating the ‘optimal’ path for the cash rate, defined as the path that minimises deviations from the RBA’s targets. 2
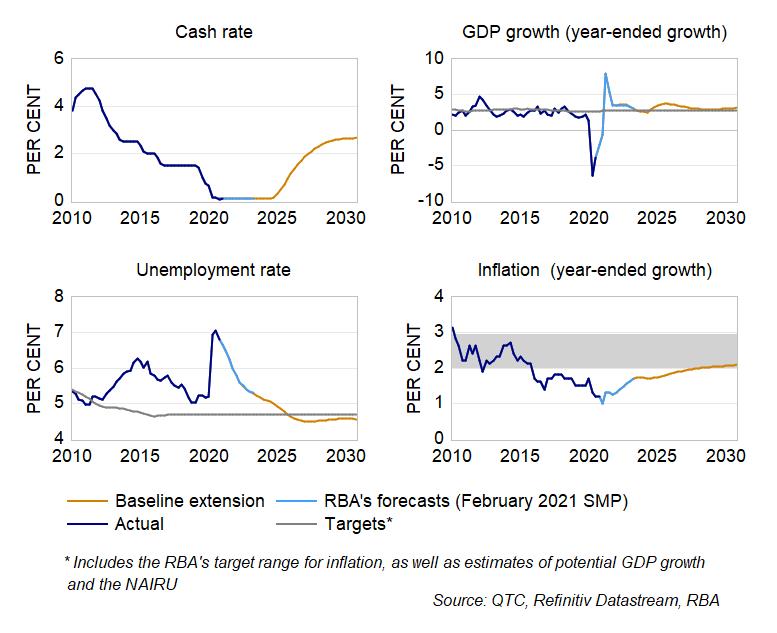
The baseline projections for the cash rate (orange series in Graph 1) assume that:
- the RBA responds to both deviations of inflation and the unemployment rate from their targets, and
- the lower bound for the cash rate is 0.1 per cent (consistent with RBA commentary that a negative cash rate is ‘extraordinarily unlikely’).
This scenario suggests that the road to a full economic recovery is likely to be slow (notwithstanding the sharp rebound at present). In this baseline case, our future projections would see:
- The cash rate remaining unchanged at 0.1 per cent until late 2024 before rising to 2.5 per cent in 2028. This is consistent with recent guidance from RBA Governor Lowe who stated that he does not expect the RBA Board to increase the cash rate before 2024 and that it is ‘possible that it will be later than this’. 3
- The low level of the cash rate supporting GDP growth, which in turn sees the unemployment rate decline gradually toward the NAIRU4 by 2025. It then remains slightly below that level through to the end of 2030.
- The low unemployment rate providing some support for inflation, though the pace of the improvement is slow. Inflation only reaches the bottom of the target band in 2027 and remains around 2 per cent through to 2030.
Graph 1: Extending the RBA’s Forecasts
Scenario 2: An increased focus on inflation
In our second scenario I look at what would happen if the RBA placed an increased focus on inflation. A particularly important assumption underpinning the first scenario is that the RBA responds to both inflation and the unemployment gap. While this is a standard assumption5, the RBA has made it clear that its current focus is on inflation. Notably, Governor Lowe has stated that, ‘the Board will not increase the cash rate until actual inflation is sustainably within the 2 to 3 per cent target range’. 6
This raises an issue for the baseline projections. In this scenario, the cash rate starts to increase at the end of 2024, despite inflation not yet reaching the RBA’s target. This is because the unemployment rate is low, so the model assumes the RBA will step in to stop the labour market from overheating. However, this is not a concern in the current environment and the Governor has identified the high rate of unemployment as an ‘important national priority’. 7
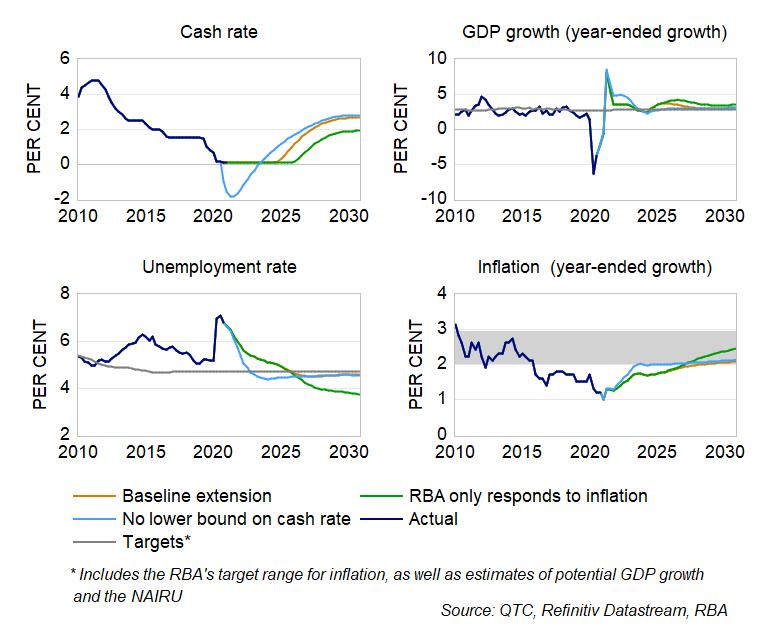
To address this issue, I have estimated the model assuming the RBA only responds to deviations of inflation from its target and places no weight on how far the unemployment rate is away from the NAIRU. The results are shown in Graph 2 (the green series).
This scenario suggests the cash rate will only start to increase in early 2026, around a year after the increase in the baseline projections. The cash rate also settles at a lower level than in the baseline projections (2 per cent by 2030, compared to 2.7 per cent for the baseline estimate). While progress remains slow, the additional monetary support sees inflation reaching the middle of the target band by 2030.
Scenario 3: What would it take to get inflation to target in the next couple of years?
Scenario 3 is different (and less likely to occur) than the previous two sets of projections. It assesses what path the cash rate would have to take to see inflation return to the target band in the next couple of years. 8
The results suggest that in the absence of a lower bound, the ‘optimal’ path is for the cash rate to be cut to almost negative 2 per cent and remain negative through to the middle of 2023 (Graph 2, light blue series).2 This hypothetical scenario results in inflation reaching the target band by the second half of 2023, compared to 2027 in the baseline scenario.
Graph 2: Cash Rate Scenarios
Now, there are lots of caveats around this exercise. It assumes monetary policy largely works as it has in the past, which is unlikely to be true with negative interest rates. It would require the RBA to adopt a much more activist approach to monetary policy than is typical for central banks. It also ignores RBA commentary on negative rates, with Governor Lowe recently stating that the RBA Board ‘… has no appetite (for rates) to go into negative territory…’. 9
Nonetheless, as the statistician George Box famously quipped, ‘… all models are wrong, but some models are useful’. Despite its flaws, this exercise suggests that substantial additional stimulus is required if the RBA is to achieve its inflation targets over the next couple of years. Based on its published forecasts, the Bank doesn’t expect to do so in this timeframe.
This is where exercises such as those in this note can be useful. Looking over a longer period we can get a sense of the potential path for the economy beyond the end of the published forecast period. Doing so reinforces the idea that the cash rate may indeed be ‘lower for longer’.