To better understand the possible path for the cash rate, we have looked at how it has behaved around its peak in previous cycles. We also consider how the current outlook might differ from previous experience. We find that the cash rate is likely to deviate from historical patterns in several ways due to some of the unique challenges that are currently facing the economy.
Is the cash rate near its peak?
Recent commentary from the RBA suggests that we could be near the peak of the cash rate. Former RBA Governor Lowe has stated that monetary policy has been restrictive for ‘some time’ and that policy is now in a ‘calibration phase’ [1], with any adjustments to interest rates likely to be based on the monthly flow of data. The RBA Board also appears to be comfortable with forecasts for inflation to fall back to its 2 to 3 per cent target range by late 2025, with a quicker return to the target band likely to require much higher interest rates and much lower employment [2].
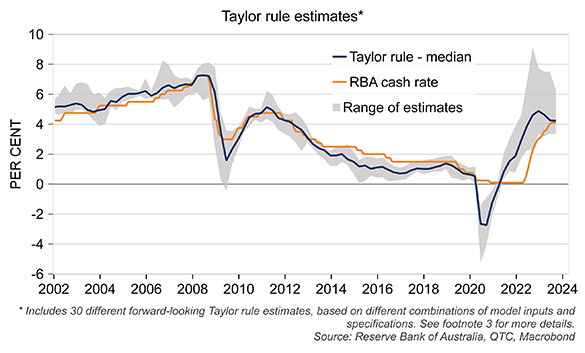
Would a pause in interest rates be warranted given the current forecasts for the economy? A simple way to answer this question is to look at variations of the Taylor rule. These rules provide a rough guide for the level of interest rates that is consistent with the outlook for inflation and economic activity. QTC Research’s forward-looking Taylor rules suggest that the current level of the cash rate is consistent with forecasts for inflation and the unemployment rate (Graph 1) [3]. These estimates also suggest that the RBA should have started to raise the cash rate earlier than it did and that rates should have previously increased by more than they have (with the median estimate suggesting a peak of around 5 per cent).
Graph 1: The cash rate may be near its peak
How has the cash rate behaved around its previous peaks?
It seems reasonable to think that the cash rate may now be at its peak. But where do we go from here? The path for the cash rate depends on the specific circumstances facing the economy, so it is hard to draw general conclusions from previous policy cycles. However, historical comparisons can often provide a useful starting point for an analysis of the current outlook.
How long do interest rates typically remain at their peak?
Over the past 30 years, Australia has had four tightening phases of monetary policy. At the peak of these, the cash rate has been held steady for between 6 and 19 months, with a median of nine months (Graph 2).
The longest peak was in 1995-96, when the RBA kept the cash rate at 7.5 per cent for 19 months amid strong economic growth and expectations for higher inflation [4]. The shortest periods were in 2001 and 2008, with the latter seeing the RBA quickly reverse course and cut the cash rate by over 425 basis points in eight months in response to the Global Financial Crisis (GFC).
Graph 2: How long has the cash rate remained at previous peaks?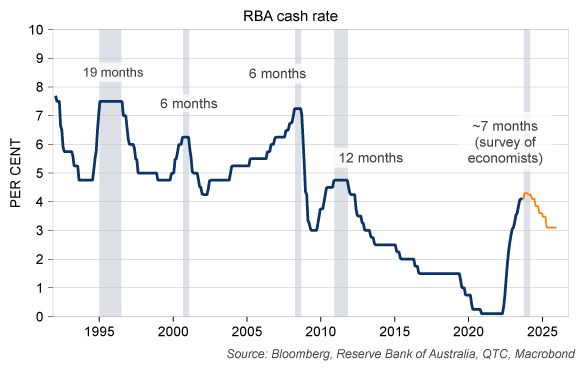
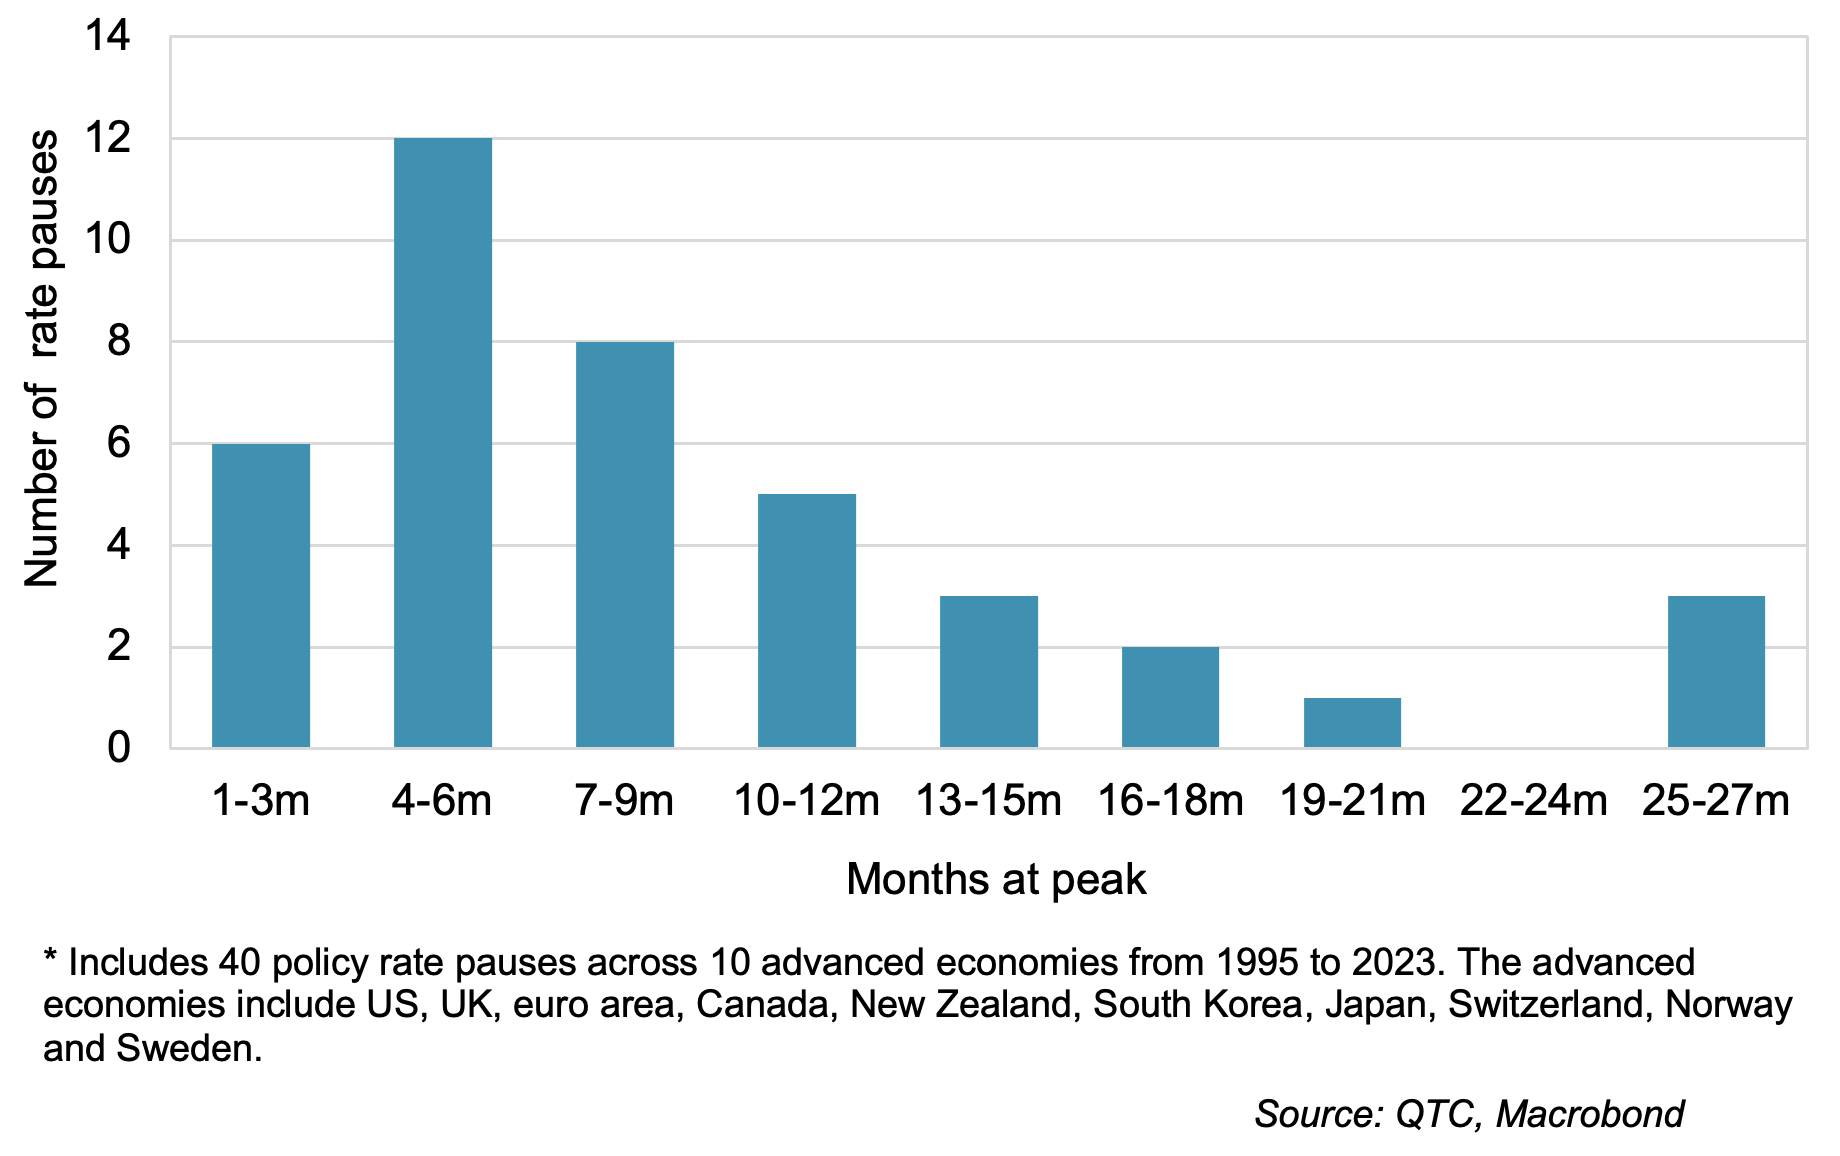
The experience across these four historical periods is comparable to that in other advanced economies. Graph 3 summarises the length of time policy rates have remained at their peaks across in 10 advanced economies since 1995. The median duration of the peaks in this sample was seven months, with 80 per cent of the pauses being shorter than a year.
Graph 3: How long have other central banks kept policy rates at their peak?
How fast do interest rates fall after the initial cash rate cut?
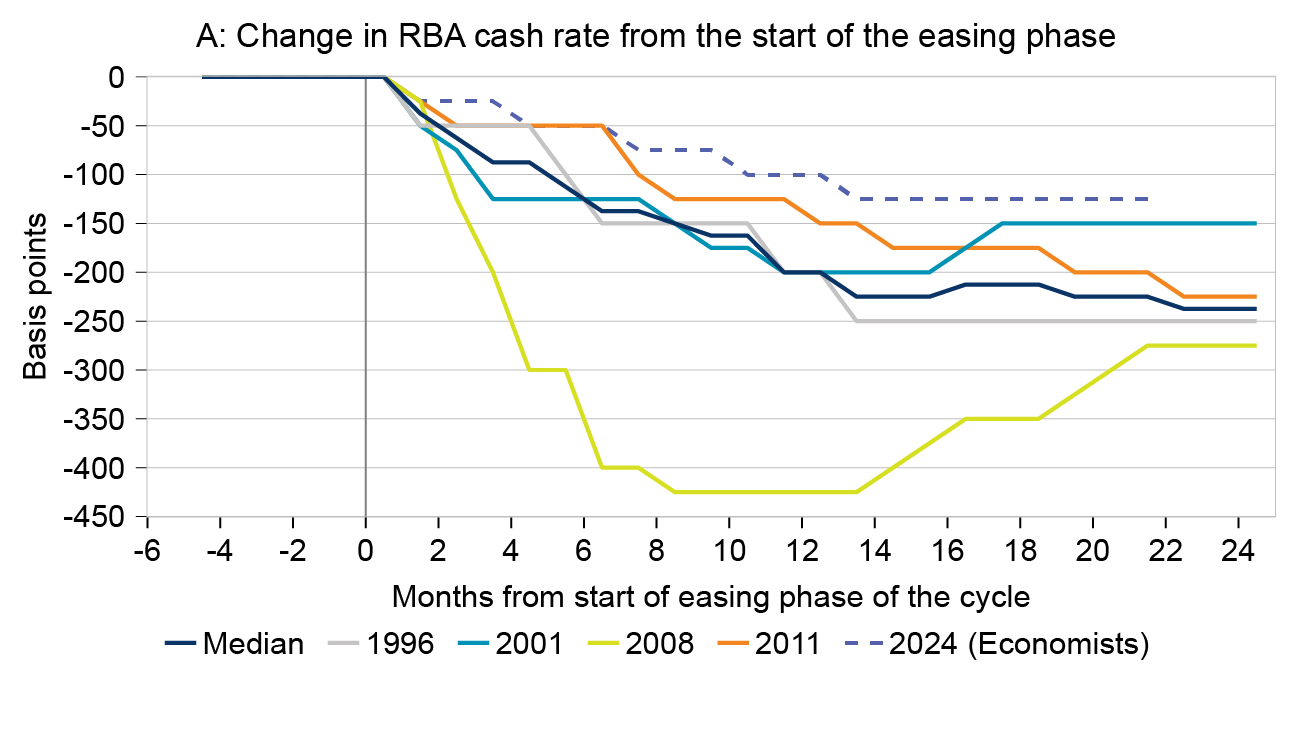
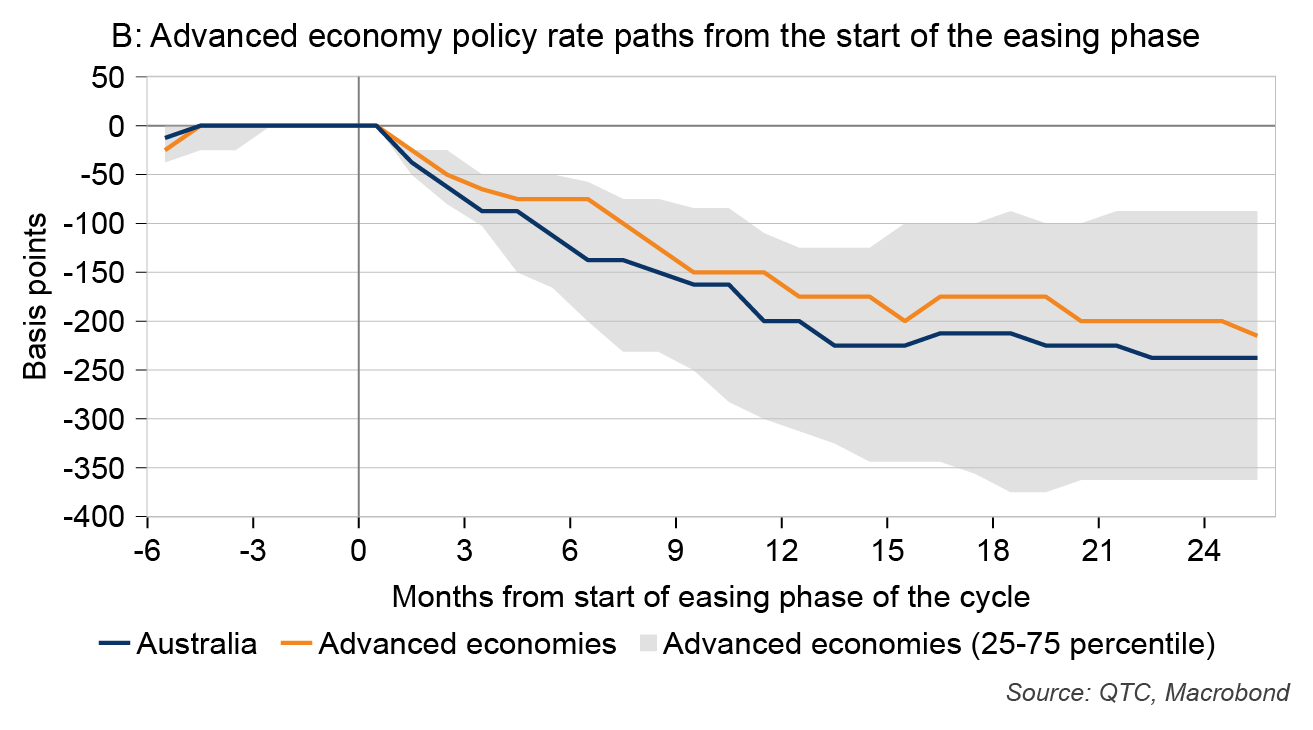
Another source of uncertainty is the speed of the decline in interest rates once policy starts to be eased. In this regard, there has been a relatively high degree of consistency across both Australian and global cycles. Apart from the sharp fall in rates during the GFC, the cash rate has historically fallen by around 200 basis points in the initial year after the first cut (Graph 4, panel A). Similarly, global policy rates are on average around 175 basis points lower than their peak 12 months after the initial cut (Graph 4, panel B).
Despite the consistency across cycles, economists are currently expecting a slower reduction in the cash rate relative to historical experience. Bloomberg’s survey of economists has a 100 basis point reduction in the 12 months following the first cut, which is around half of the historical average. Further, financial markets do not anticipate a reduction in rates through to February 2025, implying the RBA could be on hold for almost two years. While such a long pause has been relatively uncommon across previous cycles, it is plausible in the current context given some of the unique challenges facing the economy.
Graph 4: How fast have policy rates fallen following the initial cut to rates?
History never repeats but will it rhyme?
The future path for the cash rate could differ from historical experience given some of the unique aspects of this cycle. For example, a feature of previous cycles in Australia is that the RBA has not started to cut the cash rate until inflation has fallen to be consistent with its target [5]. However, because of the size of the inflation shock and the persistence of some of its drivers, the RBA’s forecasts do not have this being achieved until 2025. This points to the possibility of an extended pause (assuming the cash rate has already peaked).
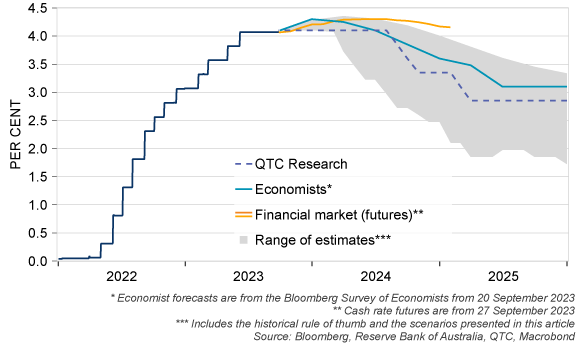
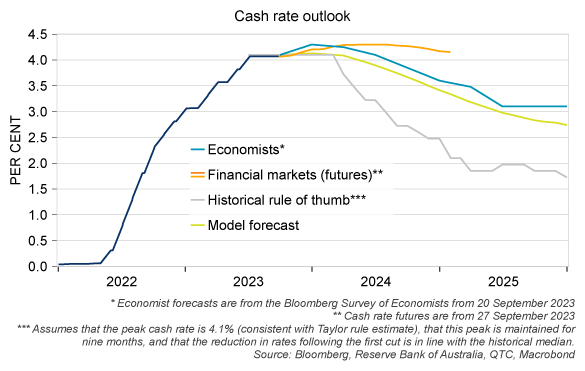
A more formal way to consider how the outlook for inflation and economic conditions could affect the path for interest rates is to use an economic model. The baseline estimates from QTC’s modified version of the RBA’s MARTIN model have the cash rate remaining at 4.1 per cent until June quarter 2024 before gradually falling to 2.75 per cent by the end of 2025 (Graph 5). This is slightly below our updated estimate of the neutral rate of 3 per cent.
These estimates are noticeably higher than a naïve extrapolation of the historical experience but are broadly consistent with the outlook from economists and financial markets. This suggests that the relatively higher cash rate outlook provided by economists and the market can largely be explained by expectations for future economic conditions.
Graph 5: The current cash rate outlook is noticeably higher than the historical rule of thumb
One reason why the reduction in the cash rate could be slower than in previous easing cycles is the path that it has travelled to date. The RBA has lifted its cash rate sharply, from a record low of 0.1 per cent in April 2022 to its current level of 4.1 per cent. However, this is still less than the monetary tightening seen in other advanced economies, such as the US, Canada and New Zealand (Graph 6). It is also below our model-based estimate of the ‘optimal’ policy path over the past 12 months, which suggests that the RBA should have raised the cash rate to around 5 per cent (followed by a faster easing of monetary policy).
The RBA Board considers a wide range of evidence when setting the cash rate, not just simple rules or models. In this case, it seems to have chosen a less aggressive tightening path to preserve some of the strength in the labour market. The implication of this policy stance is that it may take longer for inflation to return to its target, which in turn would see a slower reduction of the cash rate from its peak.
Graph 6: The RBA has been less hawkish than other central banks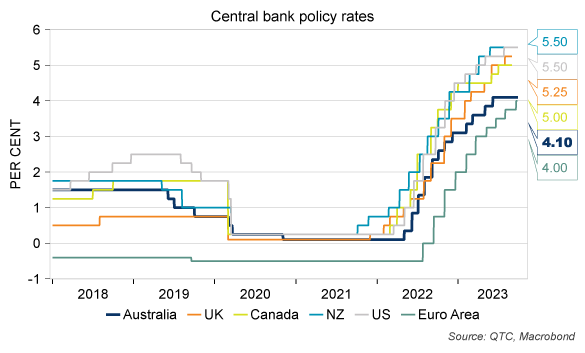
What are the risks around this outlook?
Our analysis suggests that the cash rate is likely near its peak and once rates come off this peak, could follow a path that is higher than usual. However, these estimates are underpinned by many assumptions and the outlook is still quite uncertain. Given this uncertainty, we have tested the sensitivity of the outlook to different scenarios.
‘Persistent inflation’ scenario
One factor that will affect the speed of monetary easing is the persistence of underlying inflation. The model projects a reasonably swift return of inflation to its target, but there are reasons to doubt this. For example, housing rent inflation is likely to increase further and may not respond much to higher interest rates.
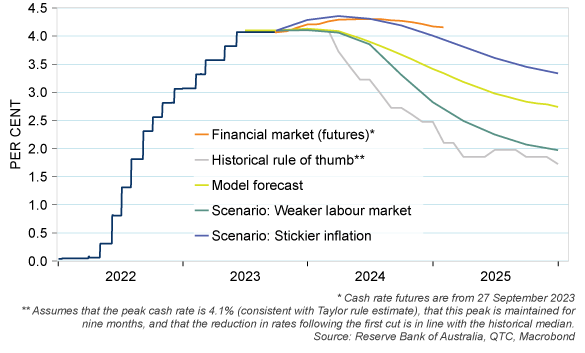
If we assume that inflation is stickier than expected, as in a previous scenario analysis, then the cash rate would need to be higher to return inflation to its target. This ‘stickier inflation’ scenario sees one more hike to 4.35 per cent and a slower easing cycle, with the cash rate at 3.35 per cent by the end of 2025 (Graph 7). This is closer to the market expectations for the cash rate, as implied by cash rate futures, suggesting that investors may be putting more weight on inflation persistence than our baseline model estimate.
Graph 7: Cash rate scenarios
‘Weaker labour market’ scenario
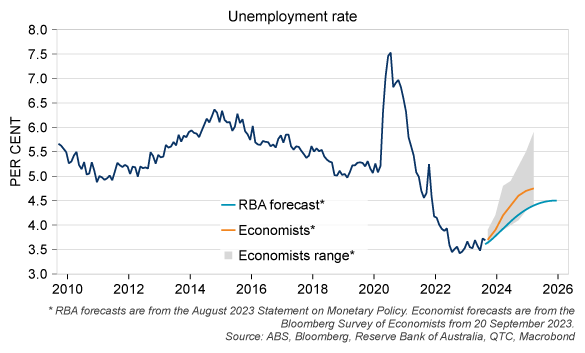
The unemployment rate has remained around its lowest level in almost 50 years since June 2022, with the RBA forecasting it will remain below its ‘sustainable’ level of around 4.5 per cent until the end of 2025.[6] This relatively strong outlook for the labour market is a key reason why the cash rate is expected to be lowered in a more gradual manner this cycle.
However, there are alternative scenarios worth considering. For example, while the RBA’s unemployment rate forecasts are consistent with our model-based projections, this outlook is noticeably stronger than that of most other economists (Graph 8). If the unemployment rate were to increase to around 5 per cent (instead of 4.5 per cent), then the projected cash rate would fall to 2 per cent by the end of 2025 (Graph 7). This path for the cash rate in this ‘weaker growth’ scenario is similar to the ‘historical rule of thumb’ projection.
Graph 8: The RBA’s labour market outlook is stronger than most other economists
Conclusion
There are strong reasons to expect the cash rate is near its peak. Financial markets and surveys of economists suggest there may be only one further hike, while model-based estimates suggest that the current level of interest rates is appropriate.
However, this does not imply that the cash rate will be lowered soon. It is unlikely that the RBA will cut its cash rate without confidence that inflation will return to its target. Gaining this confidence could take some time. Our estimates suggest that the cash rate could remain at its peak for longer than in previous cycles, that the reduction in interest rates could be slower, or both.
Based on this information, we project that the cash rate will remain at its peak until the second half of next year, most likely until August (after the June quarter 2024 CPI release; Graph 9). We then expect the cash rate to be cut to around 2.85 per cent by March 2025. The main risk to this outlook is the possibility of a further increase in the cash rate in response to sticky services inflation.
Nonetheless, predicting interest rates is challenging. Where the cash rate peaks, the duration of the pause and the speed of monetary easing could vary depending on several factors, such as the strength of the labour market and the persistence of inflation. Monetary policy is not on a predetermined path, with the RBA continuing to assess a wide range of evidence and balance various objectives when setting the cash rate.