
Yield curve-balls for economic expansions
A number of approaches have been used to predict whether the US economy will soon enter a recession. These include simple rules-of-thumb, composite measures of leading economic indicators, analysis of newspaper articles, and measures derived from corporate bond prices. The yield curve however is widely considered to have the strongest predictive power for future recessions (see Table A1 in Technical Appendix). This is not surprising given the information, which is reflected in bond yields.
Bond yields contain information about future interest rates
Longer-term yields being lower than shorter-term yields (a negative yield curve) is a sign that interest rates will be lower at some point in the future. This could occur if, for example, the central bank is expected to cut interest rates in response to a future recession. A negative or ‘inverted’ yield curve is a common occurrence ahead of US recessions (see Table A2 in Technical Appendix and Graph 1).
Graph 1: US recessions and various yield curves
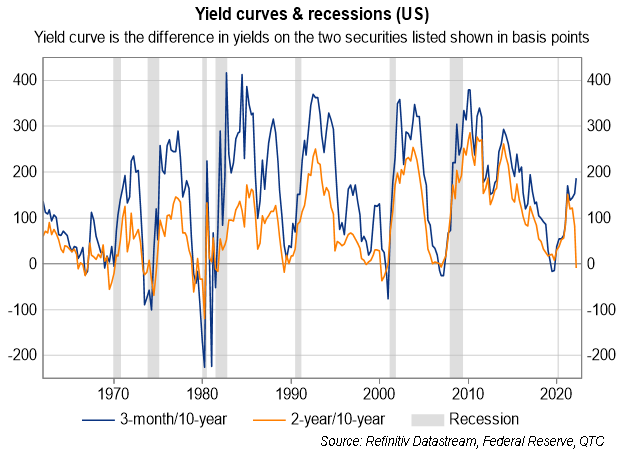
Given this, the inversion of the 2-year/10-year yield curve in early April raised concerns that the US could see a recession sooner than later. However, there are several ways in which this signal is different to those typically observed prior to recessions. These raise doubt over whether history will repeat itself.
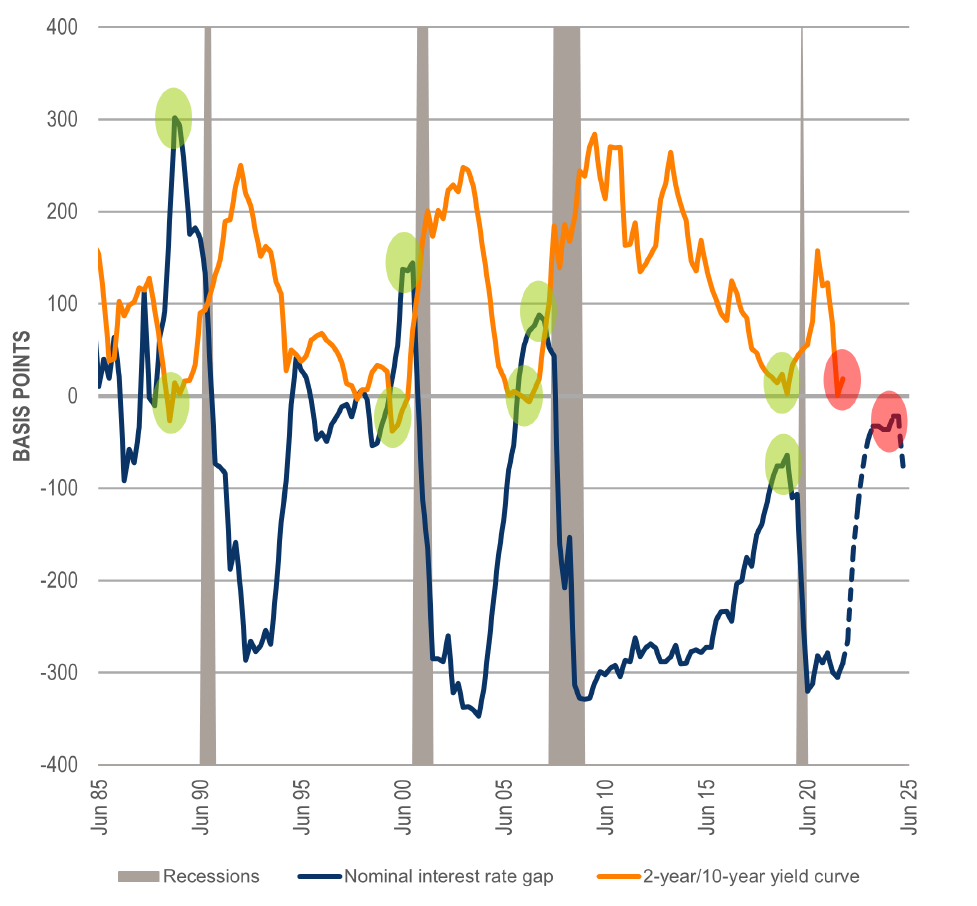
For instance, while the spread between 10-year and 2-year yields went negative, that between other points on the yield curve did not. Indeed, ahead of recessions it has normally been the case that more uniform inversions have been observed across the yield curve (Graph 2). Another difference relates to the timing of the yield curve going negative. While in previous cycles the yield curve has inverted around the peak of the rate hiking phase, this inversion has taken place at the beginning (Graph 3).
Graph 2: Yield curve specifications with a negative slope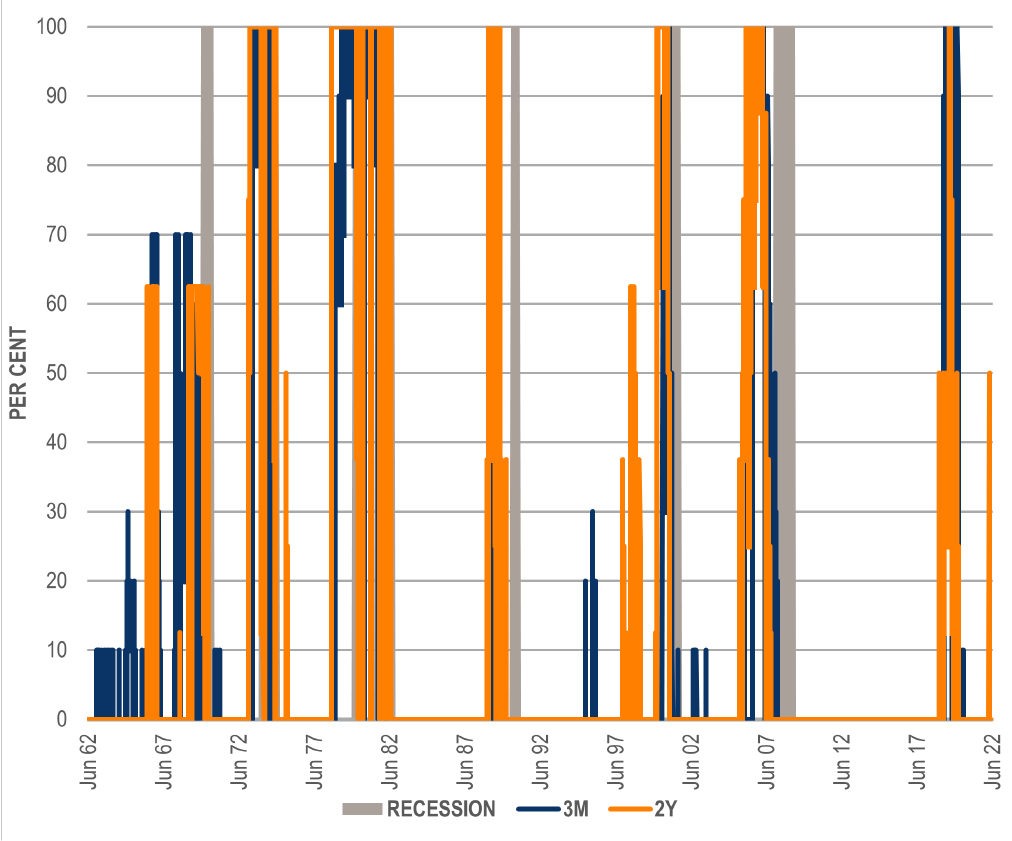
Graph 3: Policy stance vs yield curve
Note: This graph shows the share of different yield curve specifications tested which were inverted at a given time. The specifications tested were those from the maturity point listed (3-month or 2-year) out to 10‑years. For example, 3-month/1-year, 3-month/2-year, 3‑month/3‑year , all the way out to 3-month/10-year.
Source: Bloomberg, QTC Economic Reseach
Note: The nominal interest rate gap is the difference between the actual and ‘neutral’[1] Federal Funds Rate (both in nominal terms). In the historical period the neutral rate is the average of the Lubik & Matthes (2015) and Laubach & Williams (2003) estimates for neutral real rates, augmented by the University of Michigan’s 5 to 10-year ahead inflation expectations measure. In the future period, the nominal neutral rate is the long-run interest rate expectation of FOMC participants. Green dots show when the policy gap reached its peak (that is, policy settings were the tightest) at the same time as the yield curve inverted. Red dots show the situation now when timinig did not coincide.
Source: Refinitv Datastream, QTC Economic Reseach
The above points raise doubt over whether in the 2-year/10-year yield curve inverting is a recession as strong a signal as in the past. This will be explored in the coming sections where I look at the messages currently being presented by other recession indicators as well as assess their forecasting accuracy.
Yield curve based measures
In this section I use the spread between 2-year and 10-year bonds as well as several other yield-curve related measures to estimate the probability of a recession in the US in the next 12 months. I then assess how accurate these indicators are in actually predicting a future recession.[2]
22 per cent probability of a US recession over the next 12 months
At the start of the year there was less than a one-in-ten chance of a US recession in the next 12 months according to the 2‑year/10-year yield curve. By the time the yield curve inverted in early April, this probability had increased to 30 per cent. More recently, as of 19 May, there was a 22 per cent chance of a recession in the year. This is similar to the regularity with which recessions have been observed in the US historically (23 per cent of the time dating back to 1900). But is this estimated probability an accurate guide as to the chances of a recession in the next year?
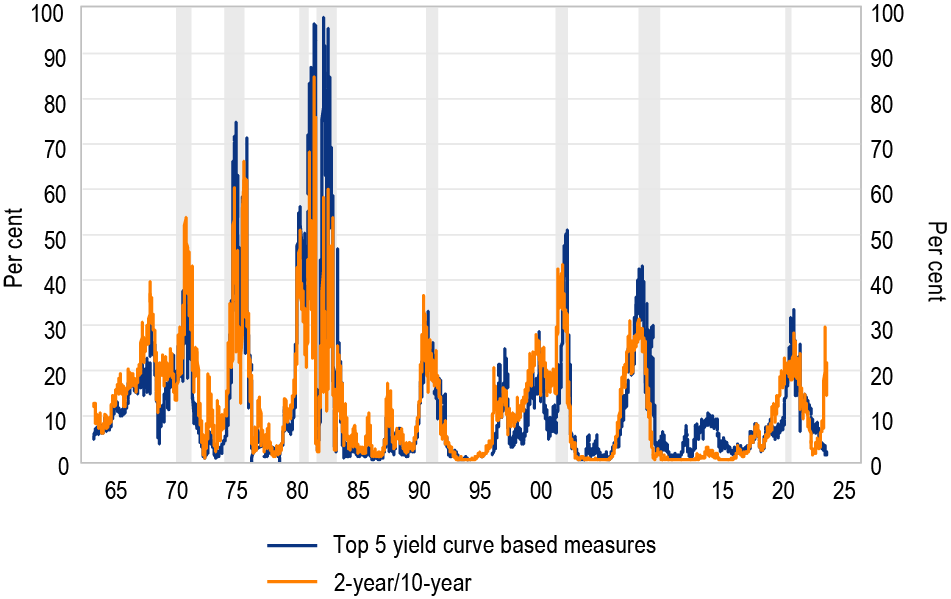
A formal analysis of the forecast accuracy of different yield-curve based measures (see the Technical Appendix for more) suggests that the 2‑year/10-year yield curve is only middle of the pack – 6th out of 11 tested – when it comes to predicting a future recession. The average of the top-5 most accurate yield curve-based measures suggest less than a two per cent probability of a US recession in the next 12 months. This suggests that the 2-year/10-year yield spread is currently overstating the likelihood of a US recession (Graph 4).
Graph 4: Recession probability estimates from yield curve-based models
Source: Gurkaynak, Sack & Wright (2006), QTC Economic Research
With the 2-year/10-year yield curve painting a different picture as to the chances of a recession in the next year to other yield curve-based measures, it is worthwhile considering alternate perspectives.
Considering alternate measures for our analysis
There are a variety of market-based measures, independent of the yield curve, which could potentially predict future US recessions. These include expected default rates, the component of credit spreads that is related to risk appetite and is unrelated to default expectations, equity valuations, financial uncertainty, and financial conditions.
Similarly, there are series which are more directly related to economic fundamentals which could offer a useful perspective on recession probabilities. These include readings on the labour market, business conditions, the cyclical element of growth, and macroeconomic uncertainty.
The challenge with trying to estimate recession probabilities from these different perspectives is that the data required for the analysis is released less frequently than yield curve data, which is available daily. This increases the chances that one’s guage of recession probabilities using these other series might not be timely when conditions are evolving quickly. Given this, I estimated a mixed frequency model which produced daily ‘nowcasts’ of recession probabilities (see the Technical Appendix for more). These estimates imply a very low probability of recession in the US over the next 12 months and are consistent with the top performing yield curve measures (Graph 5 and 6).
Graphs 5 and 6: Recession probability estimates based on financial market (non-yield curve) and economic measures
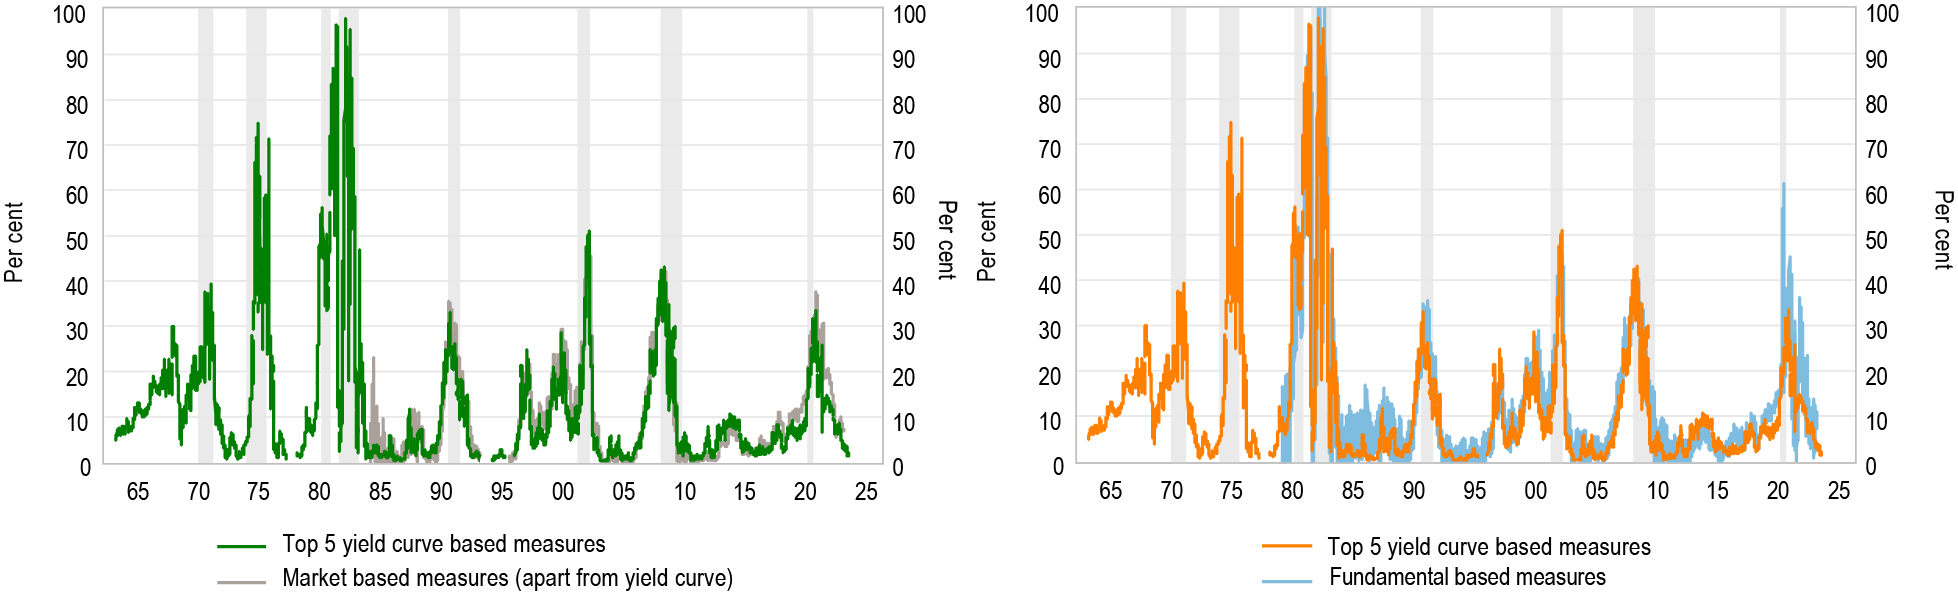
Source: QTC Economic Research
Taking an average of the different recession probability estimates reiterates that the odds of a recession over the next 12 months are lower than what is implied by the 2‑year/10-year yield spread (Graph 7), but that the chances of one over a two-year ahead horizon are increasing (Graph 8).
Graphs 7 and 8: Recession probability estimates – composite measure vs 2-year/10-year and one and two-year ahead composite measure
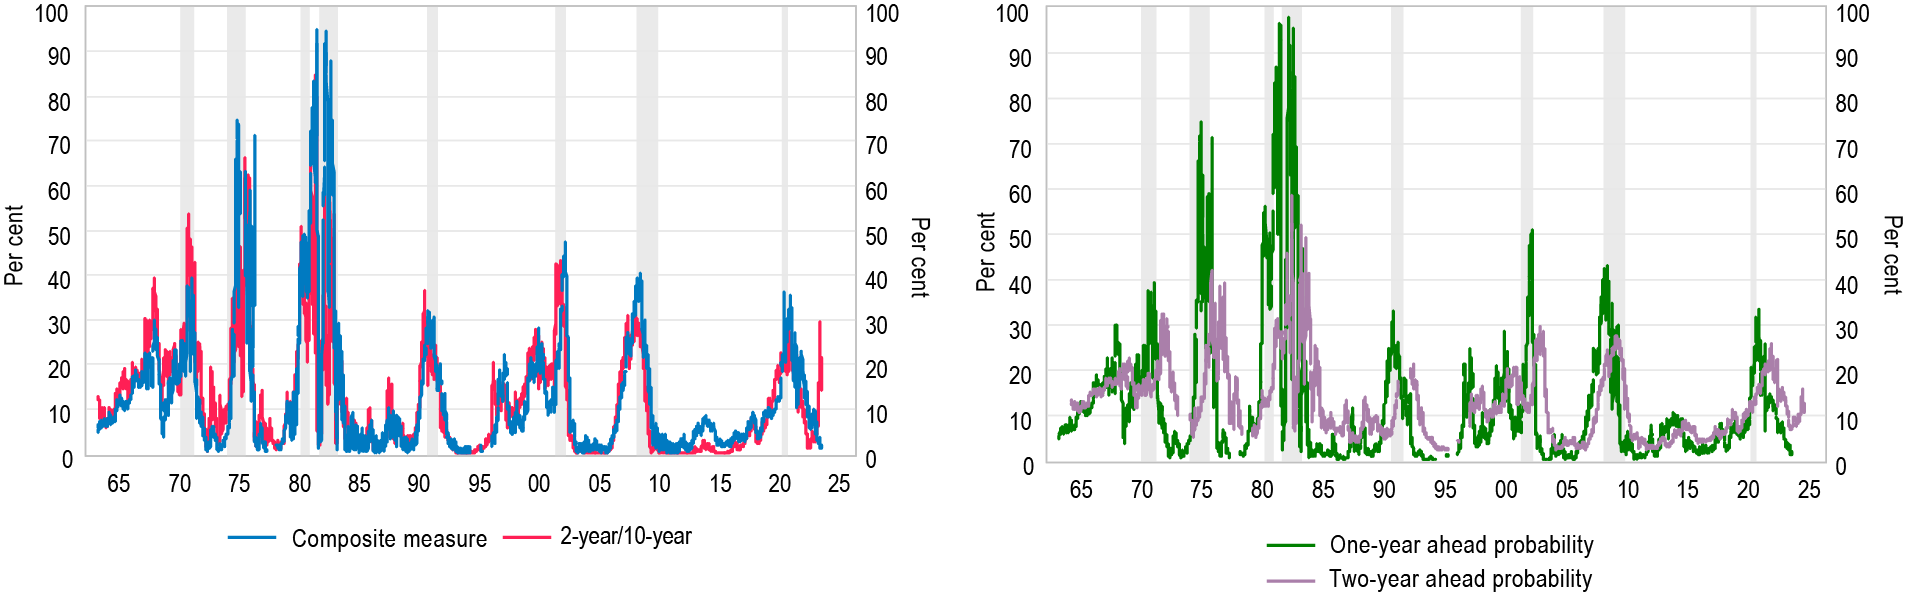
Source: QTC Economic Research
Implications of findings
Market expectations point to the US Federal Funds Rate ending the year at 2.75 per cent after having started 2022 at 0.125 per cent. This reflects the Federal Reserve moving ‘expeditiously’ to raise rates to lower inflation. After lifting interest rates by 50 basis points in May, the largest single month move in 22 years, Chairman of the US Federal Open Markets Committee (FOMC) Jerome Powell noted that similar moves ‘should be on the table for the next couple of meetings’ and that if required the Committee ‘will not hesitate’ to take interest rates to levels that will restrain economic activity if it means restoring price stability. Despite this, Powell believes that the US economy has ‘a good chance to have a soft or softish landing’.
The historical experiences on ‘soft landings’ – that is, a tightening of policy settings which slows inflation without a big increase in the unemployment rate – is limited. Recently Chair Powell cited several examples where such outcomes have been achieved (1965, 1984 and 1994). However, in these earlier instances US inflation was far below what it is today. This may mean the FOMC will have to increase interest rates to a level which increases the chance of a recession. The probability of one in the next 12 months is limited based on the analysis in this piece, despite a signal from the 2‑year/10-year yield curve which suggests otherwise. The speed and extent of rate hikes in the US does however appear to be raising the possibility of a recession there over a longer horizon.
Footnotes
[1] This is the level at which interest rates are neither stimulating nor weighing on the economy and would be expected when the labour market is at full-employment and inflation at the central bank’s target. See this note from Trent Saunders, QTC Principal Economist, for estimates of the neutral rate in the Australian context.
[2] The details of this exercise can be found in the Technical appendix