
The ‘neutral’ cash rate
Estimates of the neutral rate provide a useful benchmark as to where the cash rate could settle over the coming years. The neutral rate refers to the level of the cash rate that would neither boost nor weigh on economic activity (hence the term, ‘neutral’).2 Due to this, it is where we might expect the cash rate to be if inflation was “sustainably in the target band”, a goal that RBA Governor Lowe has emphasised on numerous occasions over the past year.
Economists typically estimate the neutral interest rate based on the observed relationship between interest rates, economic output, and inflation.3 The most widely cited estimates for the United States (US) are from Holston, Laubach and Williams (2016). The RBA uses a similar approach to estimate the neutral rate for Australia (McCririck and Rees, 2017).
Providing a more up-to-date estimate for Australia
Unfortunately, the RBA does not provide a regular update of its measure, so I have run five variations of these models to provide a more up-to-date estimate for Australia.4 A summary of the results is provided below, with further detail provided in the Technical Appendix.
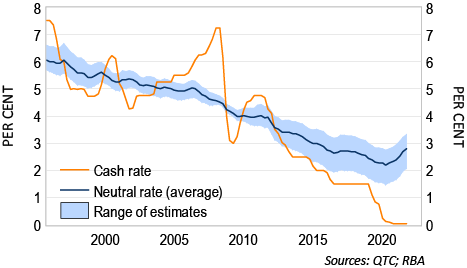
The average estimate from these models is 2.8 per cent, with the individual estimates ranging from 2.1 to 3.3 per cent (Graph 1). These levels are noticeably above the current cash rate of 0.1 per cent, with the cash rate reaching its lowest level relative to neutral since the early 1980s. This is one way of showing the extent to which low interest rates have supported economic activity since the onset of the pandemic.5
Graph 1: Nominal neutral cash rate – model estimates
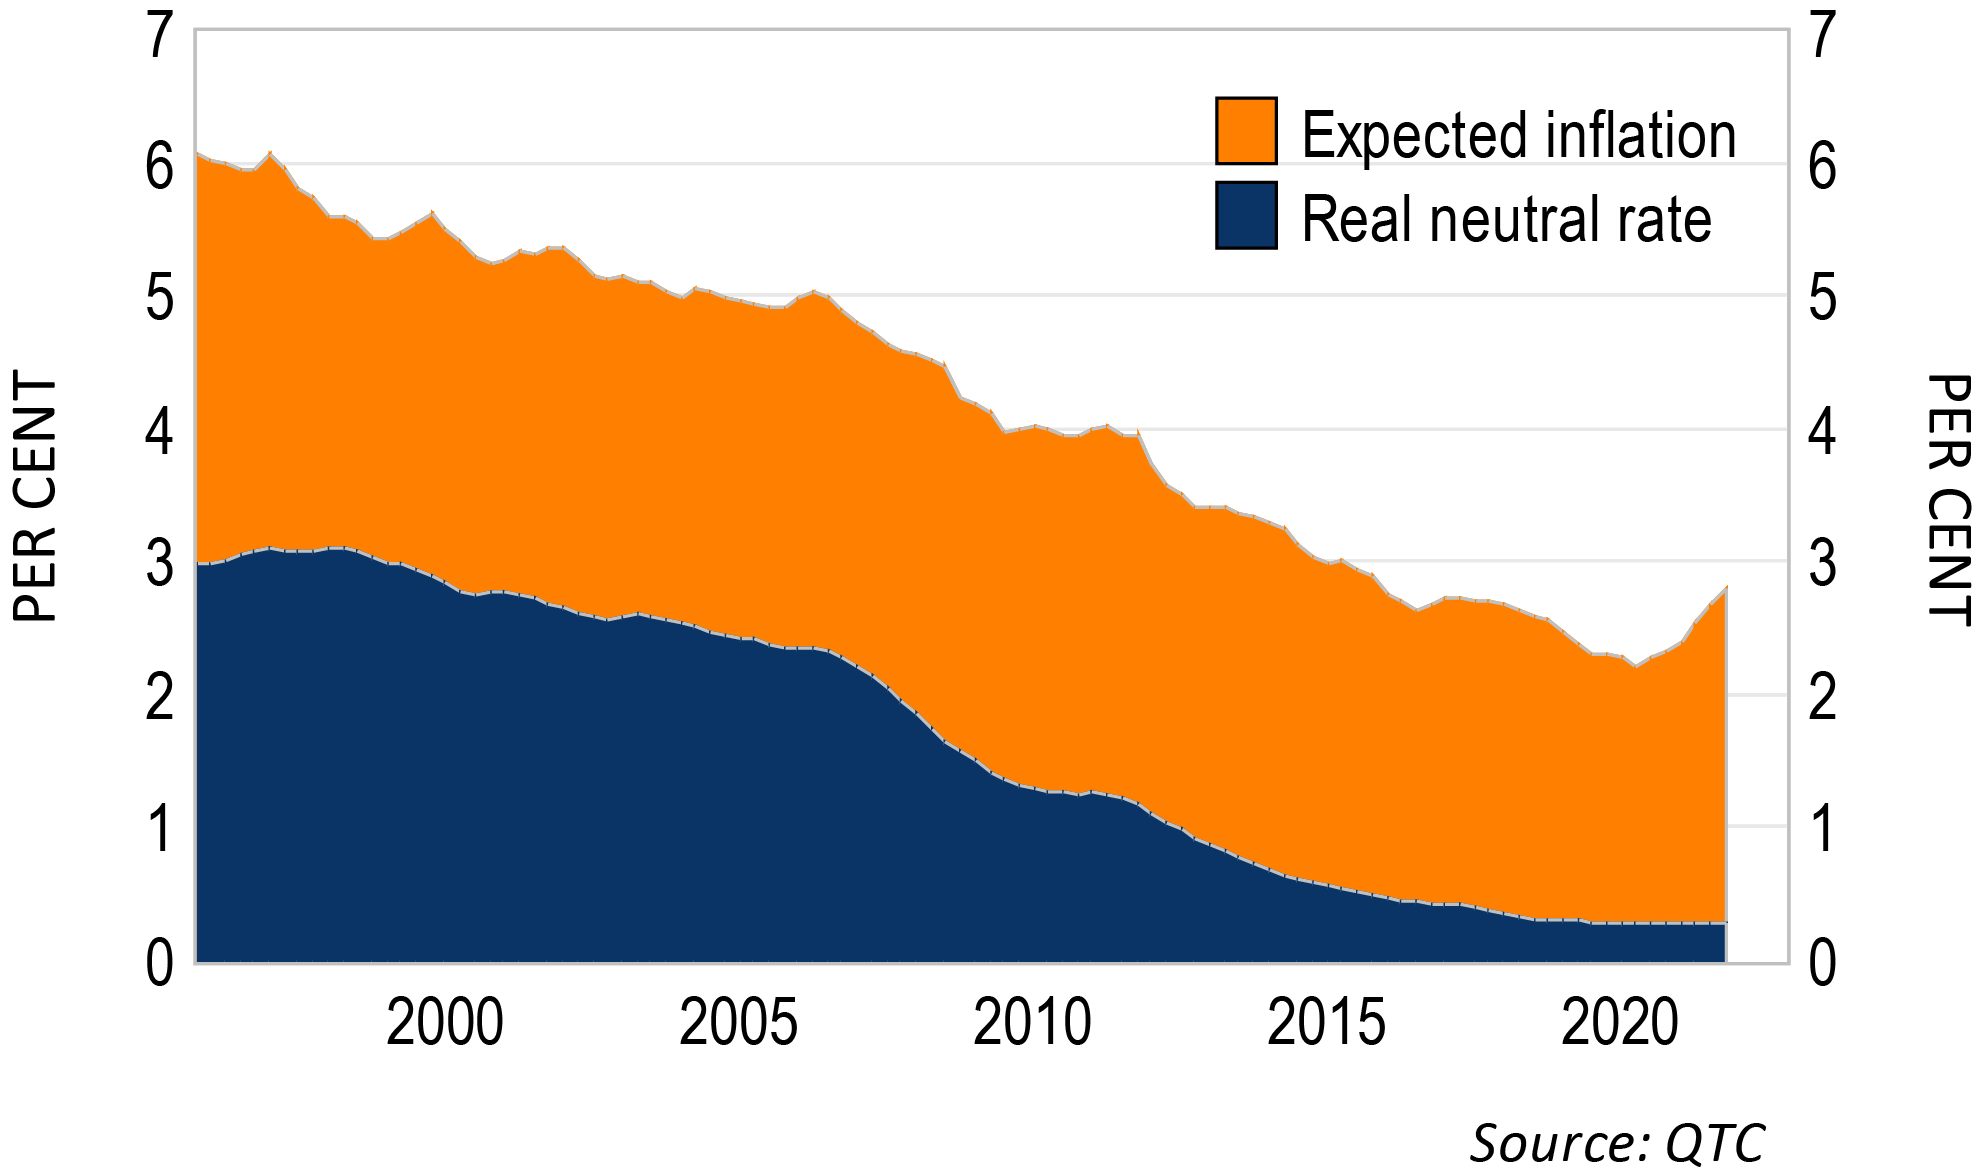
Despite these estimates being well above the actual cash rate, the level of the neutral rate is remarkably low in a historical context. The estimated neutral rate has more than halved over the past 25 years, driven by a marked fall in the real neutral rate (‘r-star’) (Graph 2). This decline in r-star has been seen across many other countries and is underpinned by several slow-moving global trends, such as the ageing population, more modest productivity growth, stronger demand for safe and liquid assets, and a general increase in global savings. Importantly, the effect of these trends on r-star is likely to persist for some time, which should see the cash rate settle well below its historical average in the period ahead.
Graph 2: Neutral cash rate – real and nominal
While the cash rate should move towards its neutral level over the course of the hiking cycle, there are several reasons to expect that the peak or ‘terminal’ cash rate might differ from the neutral rate.6 For example, if the increase in inflation is quicker and more persistent then currently expected, then it is possible that the cash rate could end up higher than the neutral rate for a period of time. Alternatively, the economy could be hit by another unexpected headwind (or ‘shock’), which could see the cash rate peak at a lower level. These are two examples of a range of factors that could affect the terminal rate.7 Nonetheless, given the terminal rate could be either lower or higher than the neutral rate, these estimates of the neutral rate still provide a reasonable gauge as to where the cash rate could peak.
How do these estimates compare to financial market-based proxies?
Given the high degree of uncertainty around estimates of the neutral rate, it is useful to cross-check these results against other proxies for neutral and terminal rates.
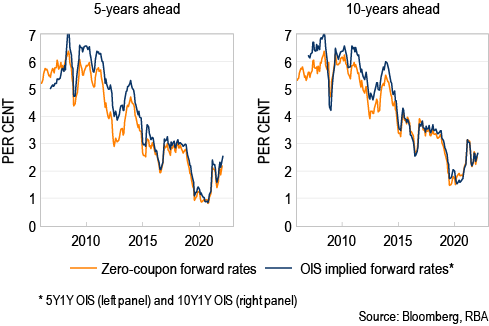
A common measure used by economists is financial market pricing for short-term interest rates five- to ten-years ahead.8 Current financial market pricing is broadly consistent with the model-based estimates of the neutral rate, suggesting that short-term interest rates will be around 2.5 per cent five years from now and at 2.7 per cent after ten years (Graph 3).
An advantage of this approach is that it provides a simple, model-free estimate of future short-term interest rates. However, interpreting forward rates for this purpose is not straightforward, as these rates will also be affected by the term premium (that is, the premium that is paid or received by investors for holding longer-dated bonds rather than a series of shorter-dated ones). Research suggests that the term premium can be large and vary noticeably over time, so it is useful to view these expectations alongside other estimates for the terminal or neutral rate.
Graph 3: Financial market measures of cash rate expectations
What does debt serviceability tell us about the outlook for the cash rate?
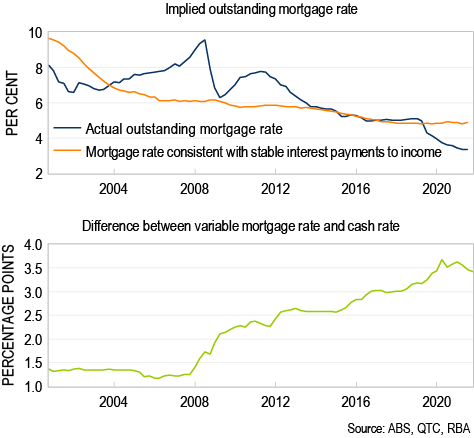
Financial market economists also often use rules-of-thumb for debt serviceability to gauge where the cash rate might eventually settle. One approach is to estimate the level of the mortgage rate that would see housing interest payments as a share of income return to its historical average. The results from this exercise suggest that this would occur when the mortgage rate is 5 per cent, which would imply a cash rate around 1.5 per cent (based on the current spread between mortgage rates and the cash rate, Graph 4).
Graph 4: Rule of thumb for debt serviceability
While this approach is simple and intuitive, it has some limitations.
First, this approach assumes that the sustainable or ‘equilibrium’ level of interest rates falls as the household sector becomes more indebted. While this has some intuitive appeal, academic research finds that other factors are much more important in explaining the global decline in neutral rates.
Second, it is not clear where the interest payment-to-income ratio might eventually peak. While the baseline estimate assumes that it will increase to its historical average, the previous two hiking cycles saw increases that were far larger than this (Graph 5). If, for example, interest payments to income increased to its 2011 peak (that is, 9 per cent), then the cash rate would be expected to increase to 3 per cent. If it instead increased to its 2008 peak of 10½ per cent, then the implied cash rate would be just over 4 per cent.
Despite the limitations of this approach, the midpoint of this range of estimates (2.8 per cent) is still consistent with the estimates of the neutral cash rate and financial market-based proxies for the terminal rate.
Graph 5: Interest payments – as a share of income
Summary
In this note I examined where the cash rate might settle over the coming years. These different outlooks are summarised in
Table 1.
The estimates from these approaches suggest that the cash rate could increase to be slightly above 2½ per cent, with most of the individual estimates ranging from 2 to 3.3 per cent. The broad consistency across different approaches provides more confidence in the results, given each approach has its own strengths and weaknesses.
Despite this, it could take some time before the cash rate reaches these levels, with recent commentary suggesting that the RBA is taking a cautious approach to increasing the cash rate. Projections from a modified version of the RBA’s MARTIN model suggest that the cash rate is likely to reach its neutral level in mid-2025. If inflation were to continue to surprise to the upside though, then it is possible that the terminal rate will end up slightly higher than the neutral rate at this time.
Table 1: Summary of medium-term cash rate estimates
| Estimate | Real Rate | Nominal rate |
| All estimates (average) | 0.1 |
2.6 |
| Low* | -0.5 | 2.0 |
| High* |
0.8 | 3.3 |
| Neutral-rate models (average) | 0.3 | 2.8 |
| McCrirrick-Rees |
0.6 |
3.1 |
| McCrirrick-Rees (with unemployment rate) |
-0.4 |
2.1 |
| McCrirrick-Rees (with import prices) |
0.8 | 3.3 |
| Holston, Laubach and Williams | 0.8 | 3.3 |
| Laubach and Williams | -0.4 | 2.1 |
| Financial market proxies (average)** | -- | 2.6 |
| 5Y1Y OIS |
-- | 2.7 |
| 5-year zero coupon forward rate |
-- | 2.2 |
| 10Y1Y OIS |
-- | 2.8 |
| 10-year zero coupon forward rate |
-- | 2.5 |
| Debt serviceability measure (average) | 0.3 | 2.8 |
| Interest payments to income return to their: | ||
| - Post inflation targeting average | -1.1 | 1.4 |
| - 2011 peak | 0.5 | 3.0 |
| - 2008 peak | 1.6 | 4.1 |
| Trend measures (average) | -0.4 | 2.2 |
| 5-year moving average of real cash rate*** | -0.2 | 2.3 |
| Unobserved components model*** | -0.5 | 2.0 |
Sources: Bloomberg, QTC, RBA
*Excludes the debt serviceability based measure given the particularly wide range of results from this approach
** OIS rates are as of 22 February 2022; zero-coupon forward rates are as of 31 January 2022
***The trends in real rates are estimated up to 2019 and held constant thereafter. The nominal rate estimates is this real rate plus inflation expectations for Q4 2022
Footnotes
(1) Cash rate futures are currently pricing in the first increase for June 2022, though surveys of economists imply a later timing for cash rate increases. At the time of the last Bloomberg survey (27 January 2022), around a third of market economists expected the cash rate to have increased by the September quarter, with a further third expecting an increase in the December quarter.
(2) The neutral rate typically refers to the real policy rate that is consistent with output at potential and stable inflation over the medium term. However, in this note I focus on the nominal neutral rate (that is, the real neutral rate plus expected inflation), as this rate is of more relevance for financial markets.
(3) The logic underlying these models is simple. If a given level of the real policy rate results in output being above potential and inflation increasing above expectations, then the policy rate is likely to be below its neutral level (and vice versa). Economists’ combine this empirical information with economic theory to estimate how far interest rates have diverged from ‘neutral’ over time.
(4) This includes Australian versions of both Laubach and Williams (2001) and Holston, Laubach and Williams (2016), as well as the three models described in McCririck and Rees (2017). Due to volatility in the data since early 2020, I have estimated the real neutral rate up to the end of 2019, after which it has been held constant. To estimate the nominal rate, I have added this to an updated estimate of expected inflation.
(5) This does not include the support provided by the the additional monetary policy tools used by the RBA. including yield curve control, the term-funding facility (TFF) and the RBA’s asset purchases program.
(6) Where a cash rate peaks in a tightening cycle or troughs in an easing cycle is referred to as the ‘terminal’ rate.
(7) I discuss this issue in more detail in the Technical Appendix.
(8) When used as a proxy for the neutral rate, this assumes that after a period of 5 to 10 years, the economy has recovered from any current shock and returned to its equilibrium.