
Graph 1: Cash Rate Outlook
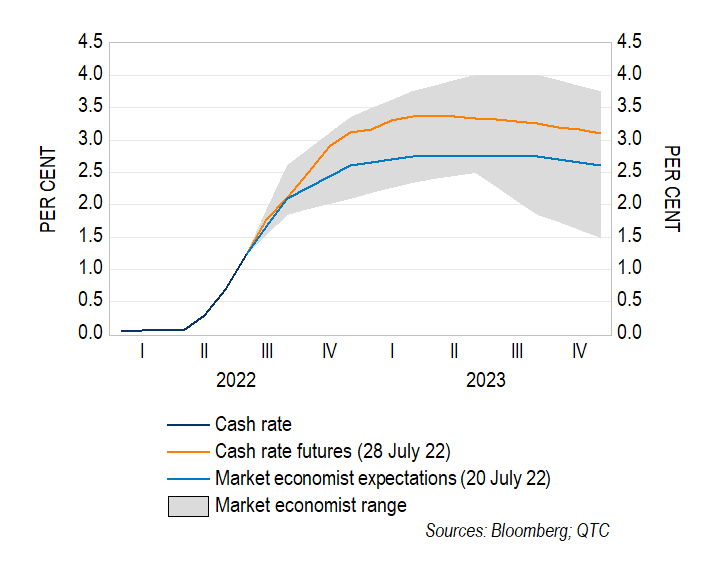
What is the effect of interest rates on economic activity and inflation?
Changes in the cash rate have wide-ranging effects on households’ and businesses’ incentives to borrow and spend. An increase in the cash rate will result in higher borrowing costs and returns on savings, lower asset prices, and a higher exchange rate, among other effects.[1] All of these forces will weigh on spending and inflation in Australia.
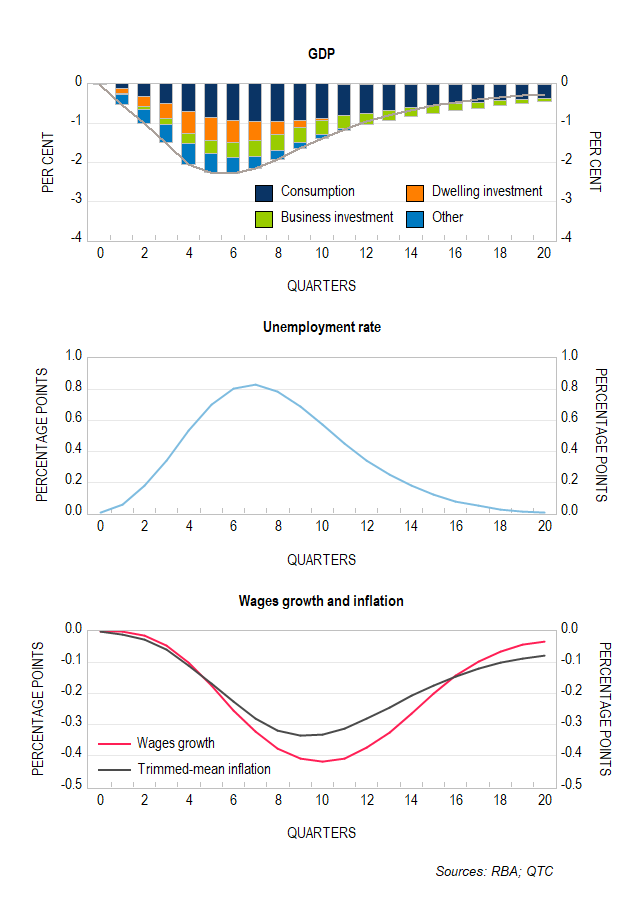
The RBA’s MARTIN model suggests that gross domestic product (GDP) would fall by over two per cent in response to a 300 basis point increase in the cash rate that persists for one year (Graph 2).[2] The largest contributors to this GDP decline are household consumption and dwelling investment, which together account for around two thirds of the fall in GDP.
The slowdown in economic activity sees the unemployment rate increase by around 0.8 percentage points, which puts downward pressure on inflation and wage growth. The responses of inflation and wages growth are estimated to be quite slow, with it taking over two years to reach its peak effects. [3]
Graph 2: Responses to a 300 basis point increase in the cash rate that persists for one year
Will cash rate increases work as they have in the past?
While all economic cycles are unique, the current one has been particularly unusual. This has led many commentators to question whether monetary policy will work as it has in the past. I discuss some of the key concerns below.
How does the increase in global rates affect the exchange rate channel of monetary policy?
The exchange rate is an important channel for monetary policy in Australia, with the RBA’s MARTIN model suggesting that it accounts for a large share of the effect of interest rates on inflation in the two years following the initial hike (Graph 3).
All else equal, an increase in Australian interest rates sees the return on Australian dollar assets increase relative to those in foreign currencies. This contributes to stronger demand for the Australian dollar which, in turn, leads to an appreciation of the exchange rate. However, for the exchange rate to appreciate, Australian interest rates need to increase by more than those in other advanced economies. If, instead, interest rates in Australia and other advanced economies increase by the same amount, then the relative return on Australian dollar assets would not increase and the exchange rate would be unchanged.
Graph 3: Response of inflation to a 300 basis point increase in the cash rate
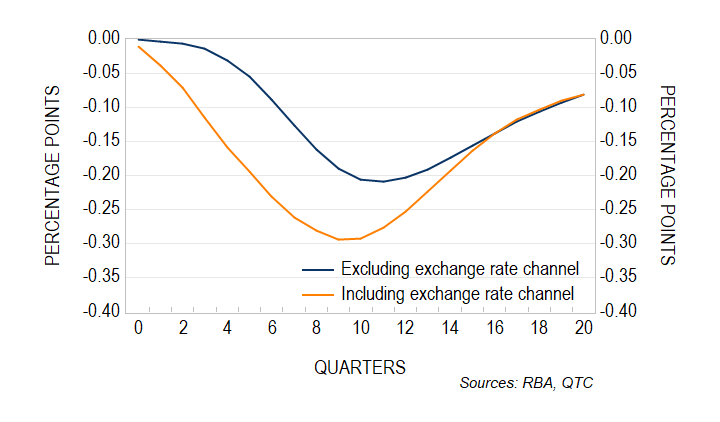
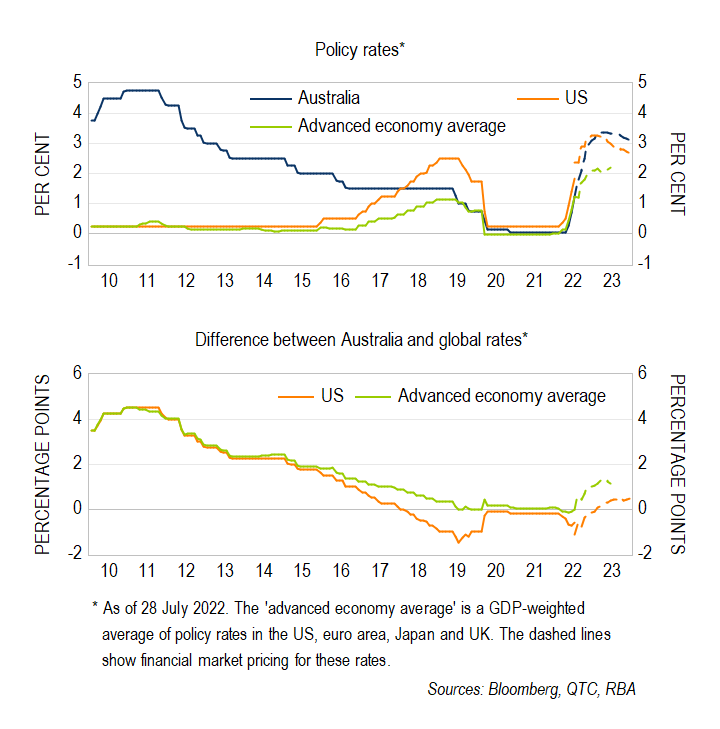
Financial markets currently expect policy rates to increase in Australia as well as across most other advanced economies (Graph 4). While domestic interest rates are still expected to increase more relative to our aggregate measures of advanced-economy interest rates, the latter will act as a headwind against the effects of the RBA’s cash rate hikes. I estimate that higher foreign interest rates will offset roughly two-thirds of the effect of expected cash rate hikes on the exchange rate. [4]
Graph 4: Global policy rate outlook
Does the current low level of the cash rate increase the effect of hikes on dwelling investment?
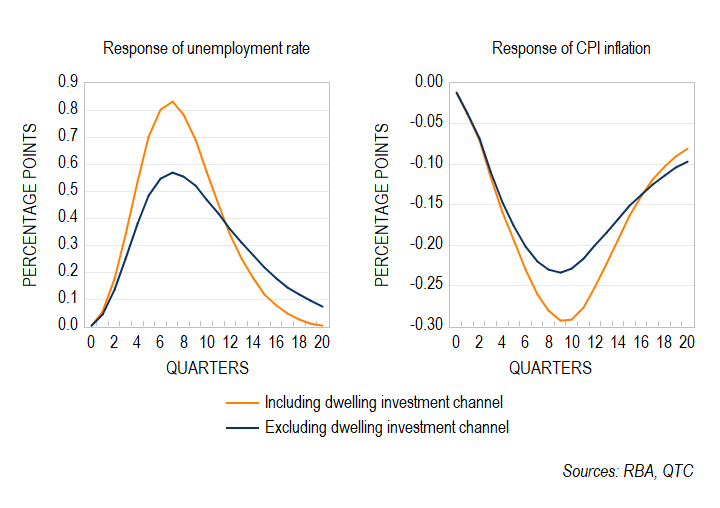
Dwelling investment is commonly estimated to be the most sensitive GDP component to interest rate changes.[5] Despite accounting for a relatively small share of GDP, it is estimated to contribute to around a third of the response of GDP to changes in interest rates, as well as one-fifth of the effect of interest rates on inflation (Graph 5).
Cash rate hikes may be more effective at reducing dwelling investment than they have been in the past, as interest rate increases have a larger effect on the housing sector when interest rates are low. For instance, the RBA’s model of the Australian housing market suggests that the response of dwelling investment to cash rate increases is roughly twice as large when lifting off from a cash rate of 0.1 per cent, relative to if the hikes occurred with the cash rate initially at three per cent.[6]
Graph 5: Responses to a 300 basis point increase in the cash rate
Will the high level of indebtedness make cash rate hikes more potent?
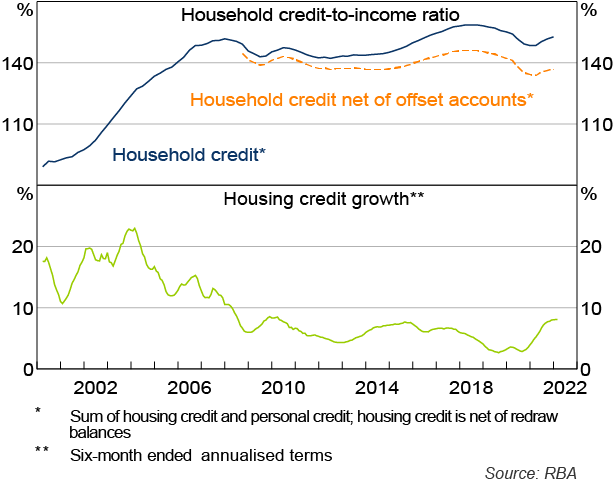
Some commentators have suggested that interest rate increases will have a larger-than-usual effect on household consumption at present, due to the high level of household debt. While there is some evidence in support of such ‘debt-accelerator’ effects in Australia, the estimated size of these effects is quite small. [7]
One possible reason for this is that borrowers have responded to past interest rate declines by building a savings buffer to offset negative income shocks. This can be seen by the lower trajectory for the household credit-to-income ratio when it is adjusted for savings in offset accounts (Graph 5). More recently, household savings have also been supported by a combination of reduced consumption during lockdowns and significant fiscal policy support to households.
To be clear, a sharp rise in interest rates will weigh on consumption, with households cutting back on discretionary spending in response to higher mortgage repayments. However, there is little evidence to suggest that the high level of household debt will see consumption fall by noticeably more than what the RBA’s models are currently predicting.
Graph 6: Household credit
Conclusion
There has been much discussion recently on how effective cash rate hikes will be with regards to reigning in inflation. While higher global interest rates will act as a headwind against the exchange rate channel of monetary policy, the low starting point for the cash rate should see a larger response of dwelling investment. Rough estimates suggest that the headwinds created by higher global rates are likely to outweigh the increased sensitivity of dwelling investment, at least in terms of its contribution to inflation.
A key area of uncertainty is the response of household spending to higher interest rates. Some commentators have suggested that high household debt will amplify the effect of cash rate increases on household consumption. However, while there is no doubt that higher interest rates will weigh heavily on consumption, it is less clear that the high level of debt will strengthen this response.
Considering these different forces, my estimates suggest the historical experience still provides a reasonable guide to the effectiveness of monetary policy in the current cycle.