What has underpinned the easing of global inflation?
Changes in global inflation over the past two years can be explained by three broad groups of prices: energy, goods and services.
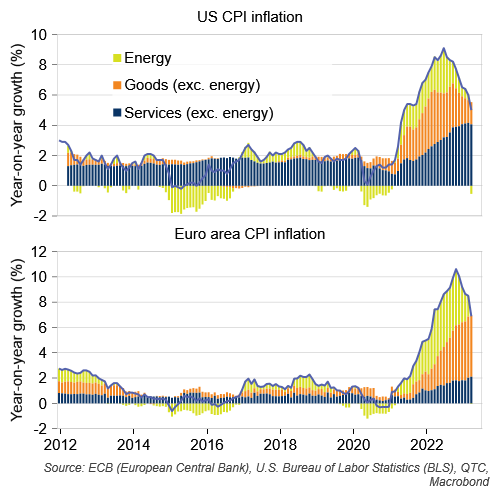
Most of the easing in inflation to date has reflected slower growth in energy prices. Energy prices account for around two-thirds of the slowdown of annual US CPI inflation and all the easing in euro area inflation (relative to its peak; Graph 1). Prior to this easing of energy prices, Russia’s invasion of Ukraine saw severe disruptions to Europe’s energy supply and a surge in global energy prices. However, prices have since been weighed down by the combined effects of slower global growth, weaker-than-expected demand from Europe,[1] and an increase in non-Russian gas deliveries to the region.
Graph 1: Energy prices explain most of the easing in global inflation
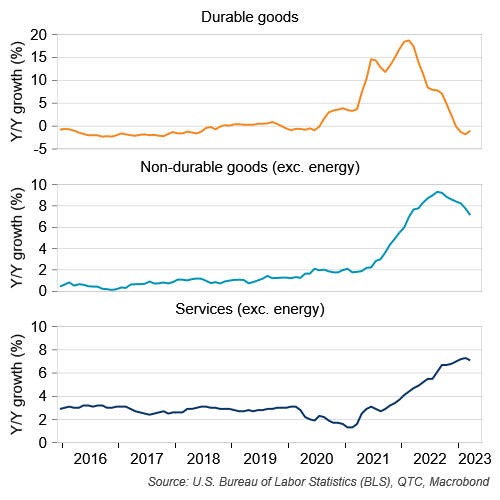
The recovery of global supply-chains and slower demand for goods has also weighed on goods inflation. This has been most notable for inflation of ‘durable’ goods (for example, cars, furniture, appliances, etc), which is now around its pre-COVID rate in the US (Graph 2). Inflation of non-durable goods (for example, food, alcohol, pharmaceutical products, etc) has been more persistent, though there are signs that these prices are also starting to slow down.
Services inflation, on the other hand, has remained relatively high. This has been underpinned by strong demand for services following the relaxation of COVID restrictions, tight labour market conditions and rising wages. It is also explained by ongoing tightness in housing markets, with ‘shelter’ prices accounting for around two-thirds of the increase in US services prices over the past year.[2]
Graph 2: US services inflation remains high
How does Australia compare to these global trends?
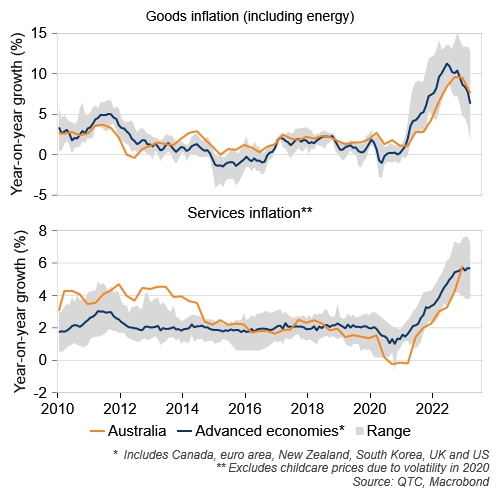
The trends in Australian inflation are comparable to those seen in other advanced economies (Graph 3). Goods inflation appears to have passed its peak,[3] while strong demand and tight labour market conditions have contributed to higher prices for services with the peak not yet clearly evident.
Graph 3: Trends in Australian inflation are comparable to other advanced economies
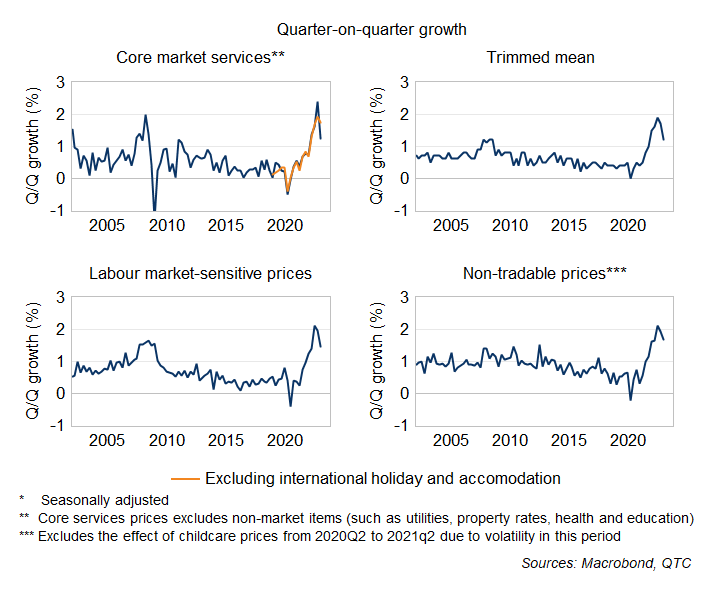
This high rate of services inflation has been mirrored across a range of other measures of underlying inflation in Australia (Graph 4). However, the recent CPI data for the March quarter provided some early signs that underlying inflation is starting to ease. Some of these movements reflected idiosyncratic factors (such as the effect of volatile international holiday and accommodation prices), but for the most part, this slower growth appears to be broad based.
Graph 4: ‘Underlying’ inflation slowed in the March quarter
What is the outlook for Australian inflation?
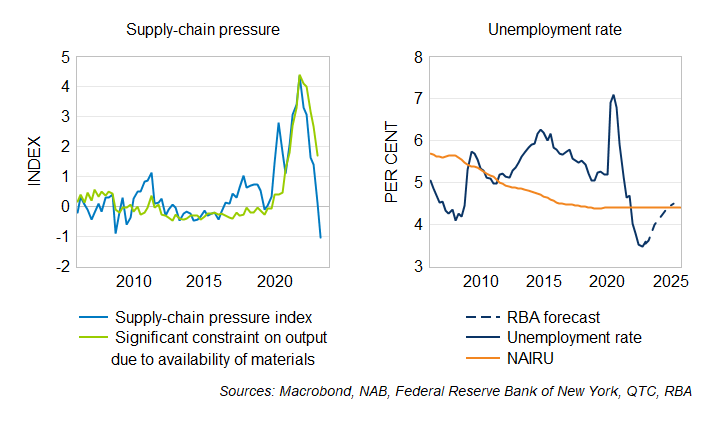
The easing of inflation is very likely to continue in the period ahead, with several factors expected to weigh on price growth. The resolution of supply-chain disruptions and slower global growth will see goods inflation continue to fall, while an expected increase in the unemployment rate should take some of the pressure off services inflation (Graph 5). Given these developments, I expect headline inflation to reach the top of the RBA’s target band by the end of 2024, with it settling around the middle of the target around a year after this.
Graph 5: Labour market tightness and supply constraints are expected to ease
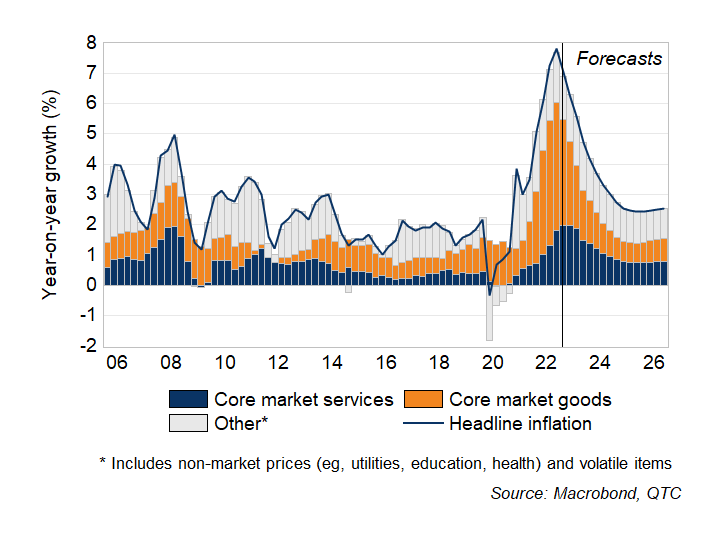
Most of the expected easing in inflation is explained by goods prices (Graph 6). The resolution of supply‑chain pressures sees core market goods inflation slow from a peak of 9.5 per cent in December quarter 2022 to 2 per cent in December 2024. The explains around two-thirds of the projected fall in headline inflation over this period.
Core market services inflation is also forecast to ease, though it remains higher-than-normal over the next 18 months due to continued tightness in the labour market. Further out, the contribution of market services to overall inflation is expected to remain around twice as large as it was in the years prior the pandemic. This sees headline inflation settle around the middle of the RBA’s target band (rather than being below the target, as was the case prior to COVID).
The remaining inflation is described by non-market prices (for example, utilities, education, health) and volatile items such as fuel and fruit prices. Non-market price growth is much more persistent than the other price categories, with growth expected to gradually fall to its pre-COVID average by the end of 2025.
Graph 6: Goods prices explain most of the expected decline in headline inflation
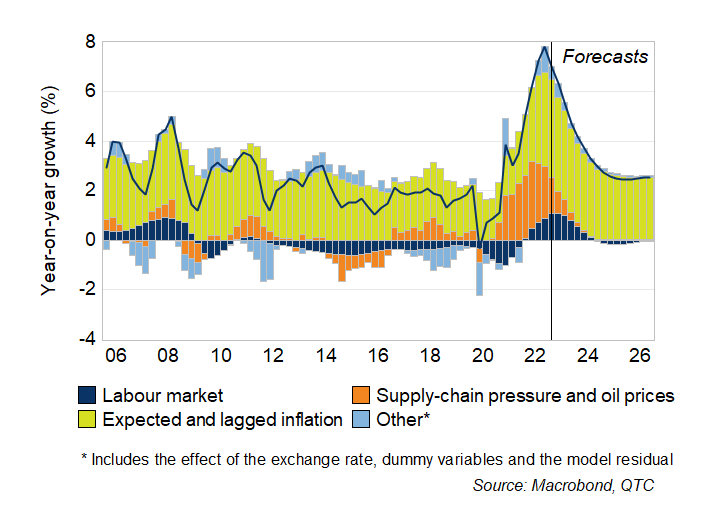
These trends can also be explained by various fundamental drivers (Graph 7). Supply-chain pressure and high oil prices explain the initial increase in inflation in 2021, though the contribution from these factors started to wane from the second half of 2022. In contrast, the effect of labour market conditions on inflation only starts to ease from the end of this year.
Graph 7: The labour markets contribution to inflation starts to ease from the end of this year
What does this mean for the RBA’s cash rate decisions?
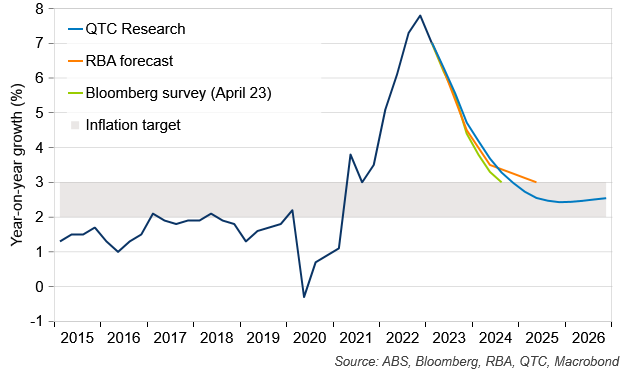
At an aggregate level, these forecasts imply inflation could return to its target slightly earlier than the RBA’s expectations (Graph 8). I estimate inflation will reach the top of the RBA’s two to three per cent target band at the end of 2024, with it falling further to 2.6 per cent by the middle of 2025. This is similar to the outlook from the latest Bloomberg survey of economists. In contrast, the RBA has inflation reaching 3 per cent by the middle of 2025.
The RBA is paying close attention to the expected timing of inflation reaching its target. In the minutes to its April 2023 meeting, the RBA Board noted that inflation returning to the top of the two to three per cent target band any later than mid-2025 would be ‘inconsistent with its mandate’. Further, the recent RBA Review recommended that the Board seek to use the mid-point of the target band as an anchor for policy, rather than aiming to be somewhere within the band.
Given the emphasis on returning inflation to its target in a timely manner, and the risk that services inflation could prove to be more persistent than expected, the RBA may decide to increase the cash rate further to ensure that it achieves its objectives. Such an approach may be prudent, with there being a risk that high inflation could become embedded in expectations if it persists for longer than expected.
Nonetheless, my forecasts suggest that a fall in both goods and services inflation could provide a welcome surprise for the RBA and see price pressures ease a bit quicker than it is currently expecting. While services inflation is likely to remain higher than it was prior to the pandemic, this should not preclude the RBA from achieving its inflation target. In fact, given inflation was below target for several years prior to the pandemic, higher services price growth could see it settle more comfortably within the RBA’s target band.
Graph 8: Inflation is expected to reach its target band by the end of 2024