The stance of monetary policy
Central banks use monetary policy to influence economic activity and inflation. However, simply looking at the level of interest rates or the size of a central bank’s balance sheet won’t indicate if these policy settings are having an expansionary or contractionary effect on the economy. Rather, given that central banks set policy to achieve full employment and inflation consistent with their targets, it is the level of rates relative to that required to achieve these goals (known as the ‘neutral rate’) which will give a sense of the stance of monetary policy.
Gauging the stance of monetary policy
There are different ways to measure the stance of monetary policy, some of which I discuss below.
Interest rate gap measures
The difference between the cash rate and the neutral rate gives a sense of whether rates are above or below that required to deliver the desired economic outcomes. These interest rate gap measures can be current or forward looking. The actual cash rate can be compared to the neutral rate to indicate the current stance of policy, while expectations for future cash rates can be used to signal what the stance might be over the period ahead. Examples of these can be seen in Graphs 1 and 2 respectively. These point to monetary policy currently being contractionary, while it is expected to be closer to neutral over the next two to five years.
Graphs 1 & 2: Measuring the monetary policy stance – interest rate gap
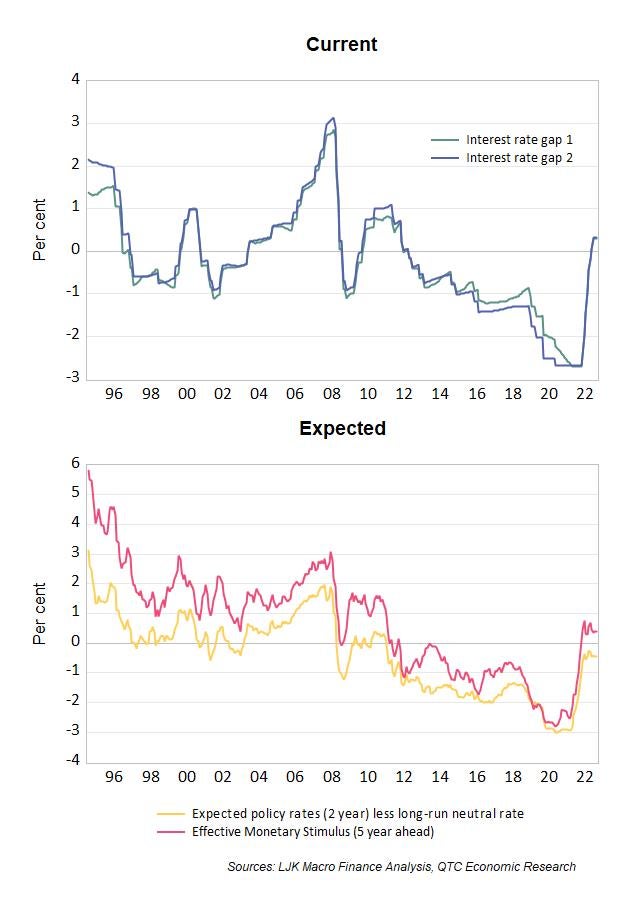
Note: Monetary policy is considered expansionary (contractionary) if the series above are negative (positive).
Expected stance of monetary policy measures were sourced from LJK Macro Finance Analysis. The Effective Monetary Stimulus measure is calculated over a five-year ahead horizon (link). The current stance proxies were estimated by QTC’s Economic research team. Interest rate gaps 1 and 2 are the difference between the actual RBA cash rate less our estimate of the real neutral rate plus a composite measure of inflation expectations or plus 2.5 percentage points respectively. The latter reflects the idea that inflation should be around the mid-point of the RBA’s target if the economy were in equilibrium.
Shadow rate gap measures
While useful, the picture painted by the interest rate gap measures in Graph 1 provides a somewhat narrow perspective on the stance of monetary policy over the past few years. This is because these estimates focus just on the difference between the cash rate and the neutral rate. However, during the COVID-19 period, the cash rate got close to zero, which required the RBA to pursue other strategies to ease monetary policy. These included expanding its balance sheet to buy government bonds and to ensure the availability of funding to lenders. To make a more complete assessment of the stance of monetary policy over this period, we need to account for this additional stimulus. Taking this wider view leads to estimates of a ‘shadow’ policy rate.[1] Measures of the gap between various shadow rates and the neutral rate can be seen in Graph 3. These highlight that monetary policy is (or will soon be) contractionary.
Graph 3: Measuring the monetary policy stance – shadow rate gap
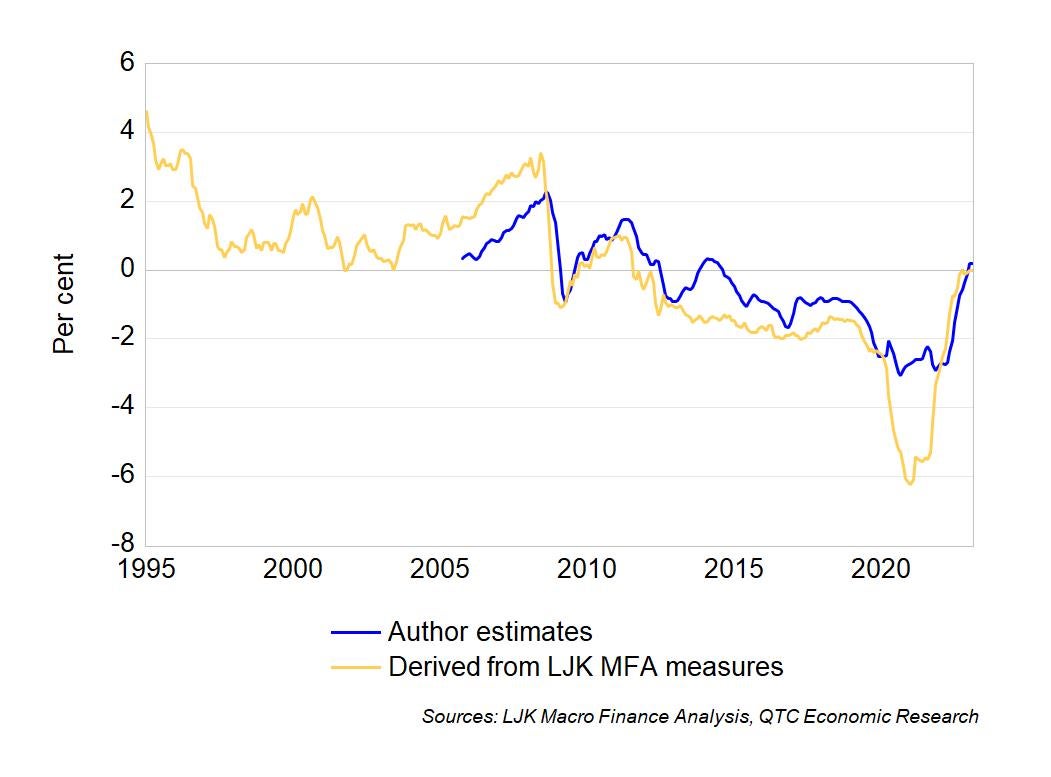
Note: Monetary policy is considered expansionary (contractionary) if the series above are negative (positive).
In Graph 3, the yellow line shows a shadow rate gap measure which was calculated as the difference between estimates of the shadow rate and neutral rate using data available from LJK Macro Finance Analysis while the blue line shows a shadow rate gap where the shadow rate was calculated using the approach set out in Doh & Choi (2016) with more detail available in Lombardi & Zhu (2018). Here, two lags of the first three principal components from a collection of interest rate and spreads as well as balance sheet measures were used. The neutral rate estimate for this gap was estimated by my colleague, QTC Principal Economist Trent Saunders, in this note.
Other interesting observations also emerge when examining these shadow rates (Graph 4). Firstly, the ‘shadow cash rate’ was negative during the pandemic. This is consistent with the prediction of simple policy rules of thumb (like for example, a ‘Taylor Rule’) which highlighted that broader actions were necessary to provide more support than would otherwise be possible given the presence of the zero bound on interest rates. The RBA delivered support consistent with these rules. Secondly, the shadow cash rate is not currently as high as the policy rule suggests. This is consistent with the Bank taking a cautious approach to tightening policy to ‘keep the economy on an even keel’ as it seeks to return inflation to target.
Graph 4: Shadow rate vs policy rule implied rate
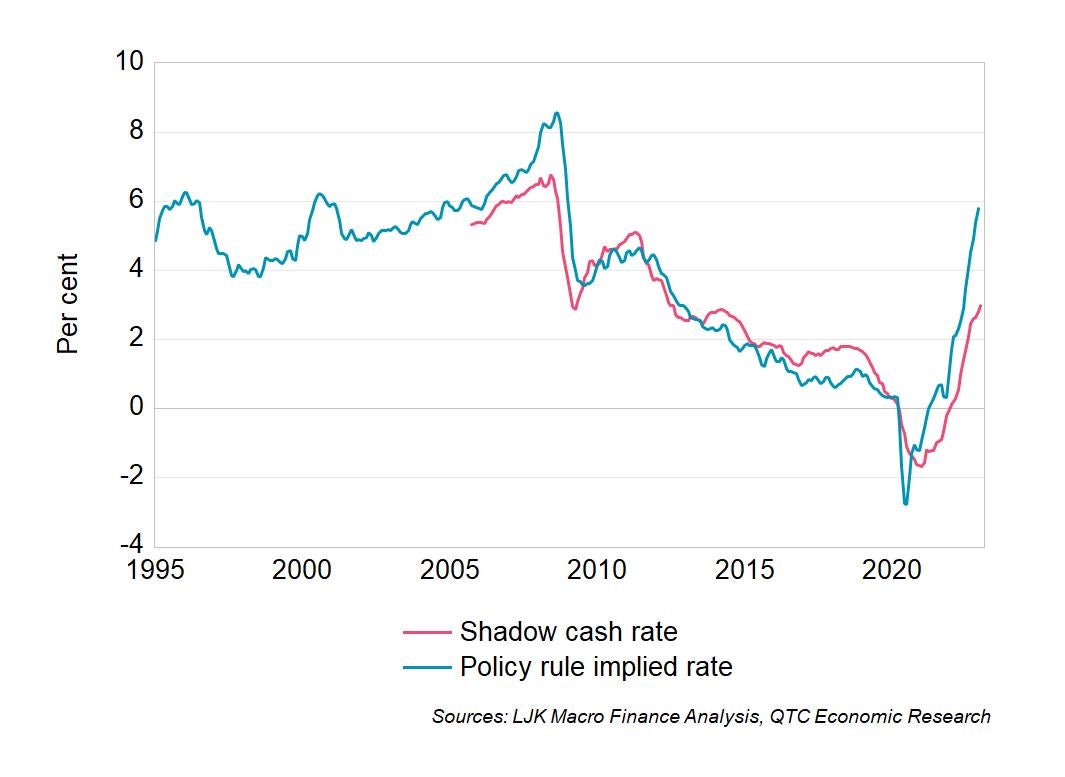
Note: The shadow rate in Graph 4 is the average of the two used to derive the shadow rate gap measures in Graph 3 while the policy rule implied rate is that from an inertial Taylor Rule.
Implications
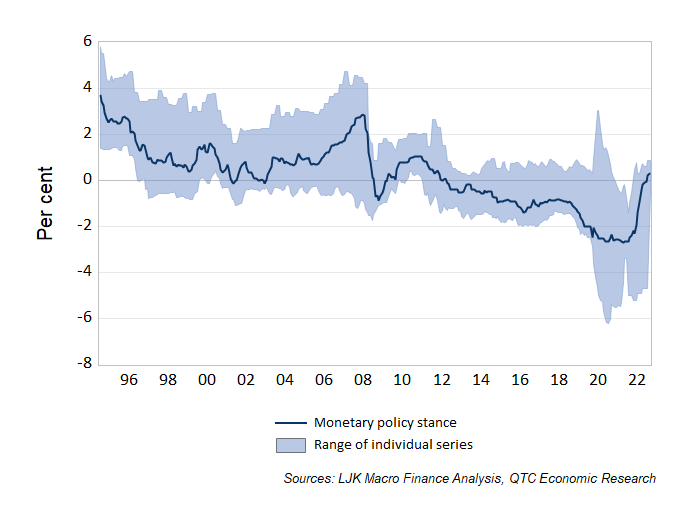
The measures above generally indicate the stance of monetary policy is contractionary. The RBA would be pleased with this given its desire to return the current high inflation to target. However, the difficulties in measuring this concept shouldn’t be overstated and the error bands around any estimates are wide. This is apparent from Graph 5 which displays the range of individual series used as possible proxies for the stance of monetary policy. The median of all these measures (dark blue line) is positive and with further increases in the cash rate expected, this could see policy tighten toward levels seen when rates peaked in 2000 and 2011 but below that seen ahead of the GFC. This suggests that monetary policy is tight, will tighten further, but has a long way to go before reaching historically tight levels.
Graph 5: Summary of the monetary policy stance