
In this article, I use two approaches to assess the uncertainty around the inflation outlook.1 Firstly, I estimate the probability that inflation will fall within various ranges two years from now based on different forecasts of inflation. Secondly, I generate probability distributions for forecasts of inflation that explicitly account for the current level of uncertainty around the outlook. I use these to show the likelihood of alternate outcomes being observed and how these can vary under different conditions.
While both of these approaches address the question slightly differently, they arrive at conclusions that can be interpreted broadly similarly. Below I outline the two exercises and their results at a high level, with further detail available in the accompanying technical appendix.
Inflation probabilities – Approach #1
Rising odds of below target inflation in two years time
The first approach estimates the probability that inflation will sit within different ranges two years from now (for example, the likelihood that inflation will be between 2.0 and 2.5 per cent). To do this, I examine two-year ahead inflation forecasts from a variety of sources. These include a simple model, the RBA, consumers, union officials, as well as financial market instruments and financial market economists.2 Based on these forecasts, I estimate the probability that inflation will lie within various ranges two years ahead.
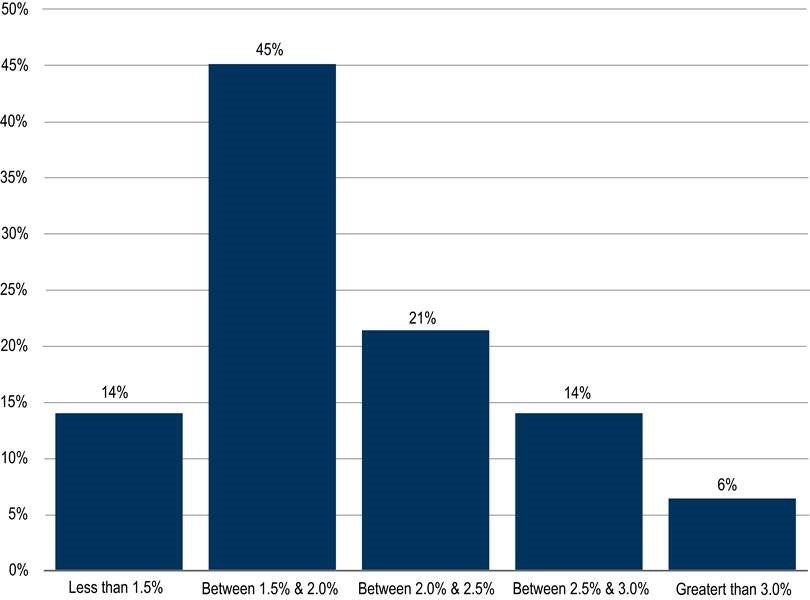
Graph 1 shows the average of these estimated probabilities. The results suggest there is a reasonable likelihood of inflation being within the RBA’s two-to-three per cent target band (35 per cent) by mid-2023, though there is an even greater probability of it being below (around 60 per cent). In contrast, the probability of inflation being greater than three per cent is relatively small (around five per cent).
Graph 1: Estimated probabilities of inflation outcomes in two years (simple average)
There is some variation in the probabilities implied by the individual forecasts. The RBA and market economist forecasts both give the highest chance of inflation being within the target band (around 50 per cent) with the model slightly lower at just over 40 per cent. The expectations of consumers (around 25 per cent) and union officials (around 30 per cent) suggest the odds of this are lower still while financial market instruments imply there is only a 15 per cent chance of inflation being within target. This is the lowest estimate across all of the forecasts. Additional graphs showing the probabilities suggested by each of the different sources are available in the technical appendix.
Graph 2 shows how these probabilities have changed over time. The likelihood of results below target have increased in recent years. This is consistent with softer inflation outcomes over this period and changes in the distribution of risks in the post-GFC period.3 The technical appendix includes a chart which breaks down these broad ranges further.
Graph 2: Time series of estimated probabilities of inflation outcomes in two years time (simple average)*
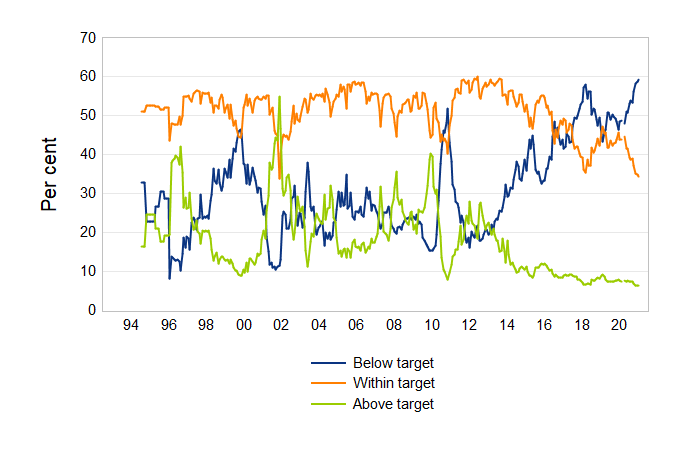
* Represents the average probability of particular outcomes for estimates that were available. Those from the model, RBA, consumers, union officials plus market economists & instruments were available from February 2007, January 1995, January 1997, February 1999, August 1996 and January 2010 respectively.
Inflation probabilities – Approach #2
Alternate approach suggests higher chance of inflation consistent with RBA target
The second approach also involves estimating the probability of future inflation outcomes being observed. However, these estimates are now conditional on measures of uncertainty around inflation outcomes.
Graph 3 shows density forecasts for inflation. From these, the probability of different outcomes across all possible ranges of inflation can be inferred. For example, the shaded areas in the graph represent the probability that inflation will be within the RBA’s target band in two years time.
Graph 3: Distribution of potential two year ahead inflation outcomes
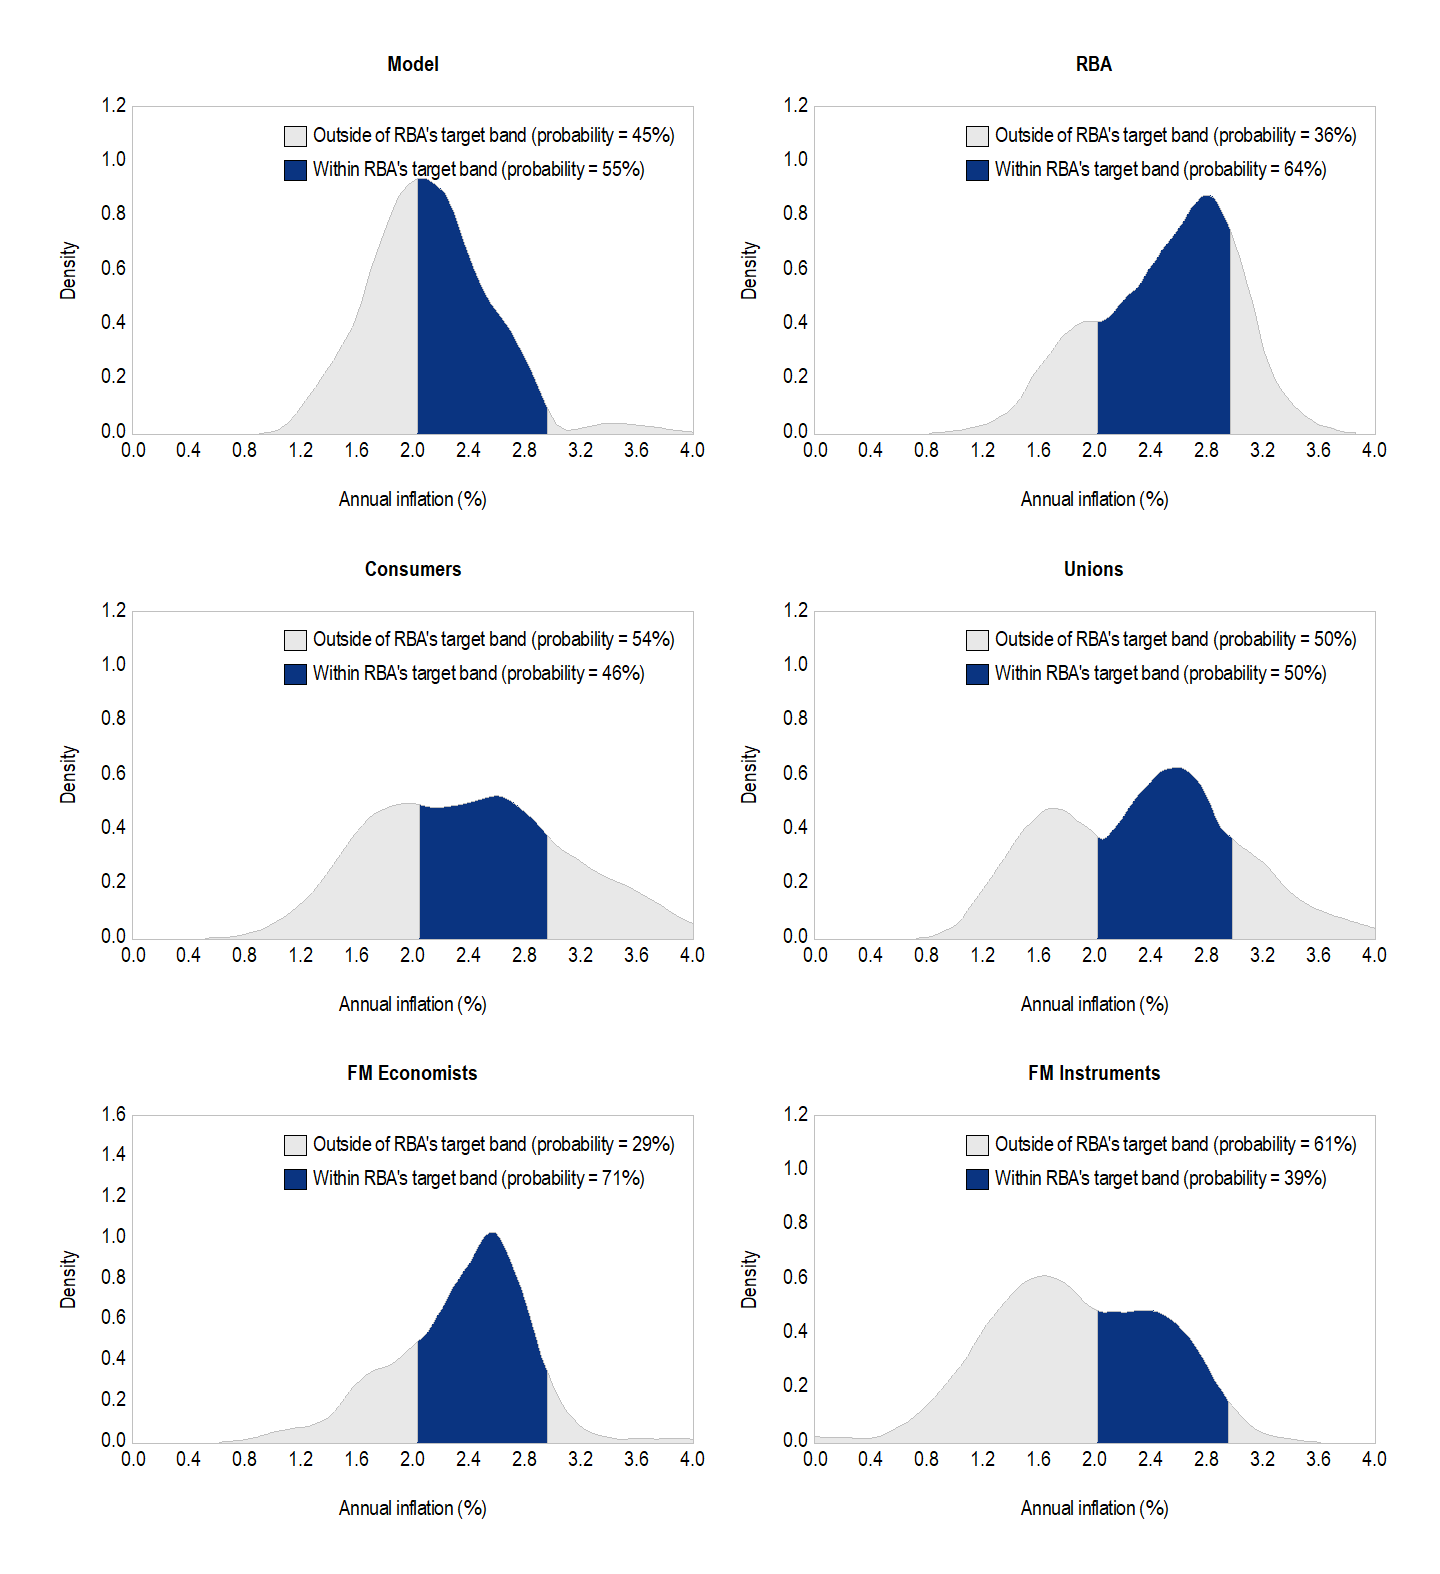
Relative to Approach 1, this approach sees a higher likelihood of inflation consistent with target. For instance, financial market economists (around 70 per cent), the RBA (around 65 per cent) and the model (around 55 per cent) now see it as being more likely than not that inflation is within the RBA’s target band in two years time. The probabilities inferred for consumers, unions and financial market instruments are all higher than in Approach 1, though all remain equal or below 50 per cent.
Some variation in results across the approaches is not surprising given the different methods employed. Approach 1 captures the relationship between actual and forecast inflation on average. This leads to outcomes that are more stable over time. In contrast, Approach 2 – by focusing on specific segments of the distribution of forecast inflation conditional on uncertainty around inflation – offers a greater degree of flexibility and customisation. Though, as a consequence, the results are less stable and more sensitive to modelling choices. Trade-offs like these are common in exercises such as this. However, by using multiple approaches to address a particular question, it is possible to bring greater awareness around these while also reducing the risk that results are overly dependent on the technique adopted.
Graph 3 is also useful to get a sense of the shape of the distribution of inflation forecasts. It is reasonably uniform for the model. The risks to the expectations of consumers and union officials are skewed slightly towards higher inflation (as shown by the larger right ‘tail’ of the distribution). The opposite is true for financial market instruments and economists.
It is also useful to look at how the balance of risks around the outlook have changed over time. At the onset of the COVID-19 pandemic, risks around the central forecast increased with most estimates suggesting there was a higher chance of very low inflation outcomes two years ahead. This is shown by how low the blue lines (the 5th percentile) were in Graph 4 in early 2020. Since that time and consistent with the stronger-than-expected economic recovery, most estimates suggest that the chance of these lower inflation outcomes have largely faded. Nonetheless, the gaps between the 5th and 95th percentiles are still wider than has historically been the case, suggesting uncertainty about the outlook for inflation still persists.
Graph 4: Inflation forecasts by percentile*
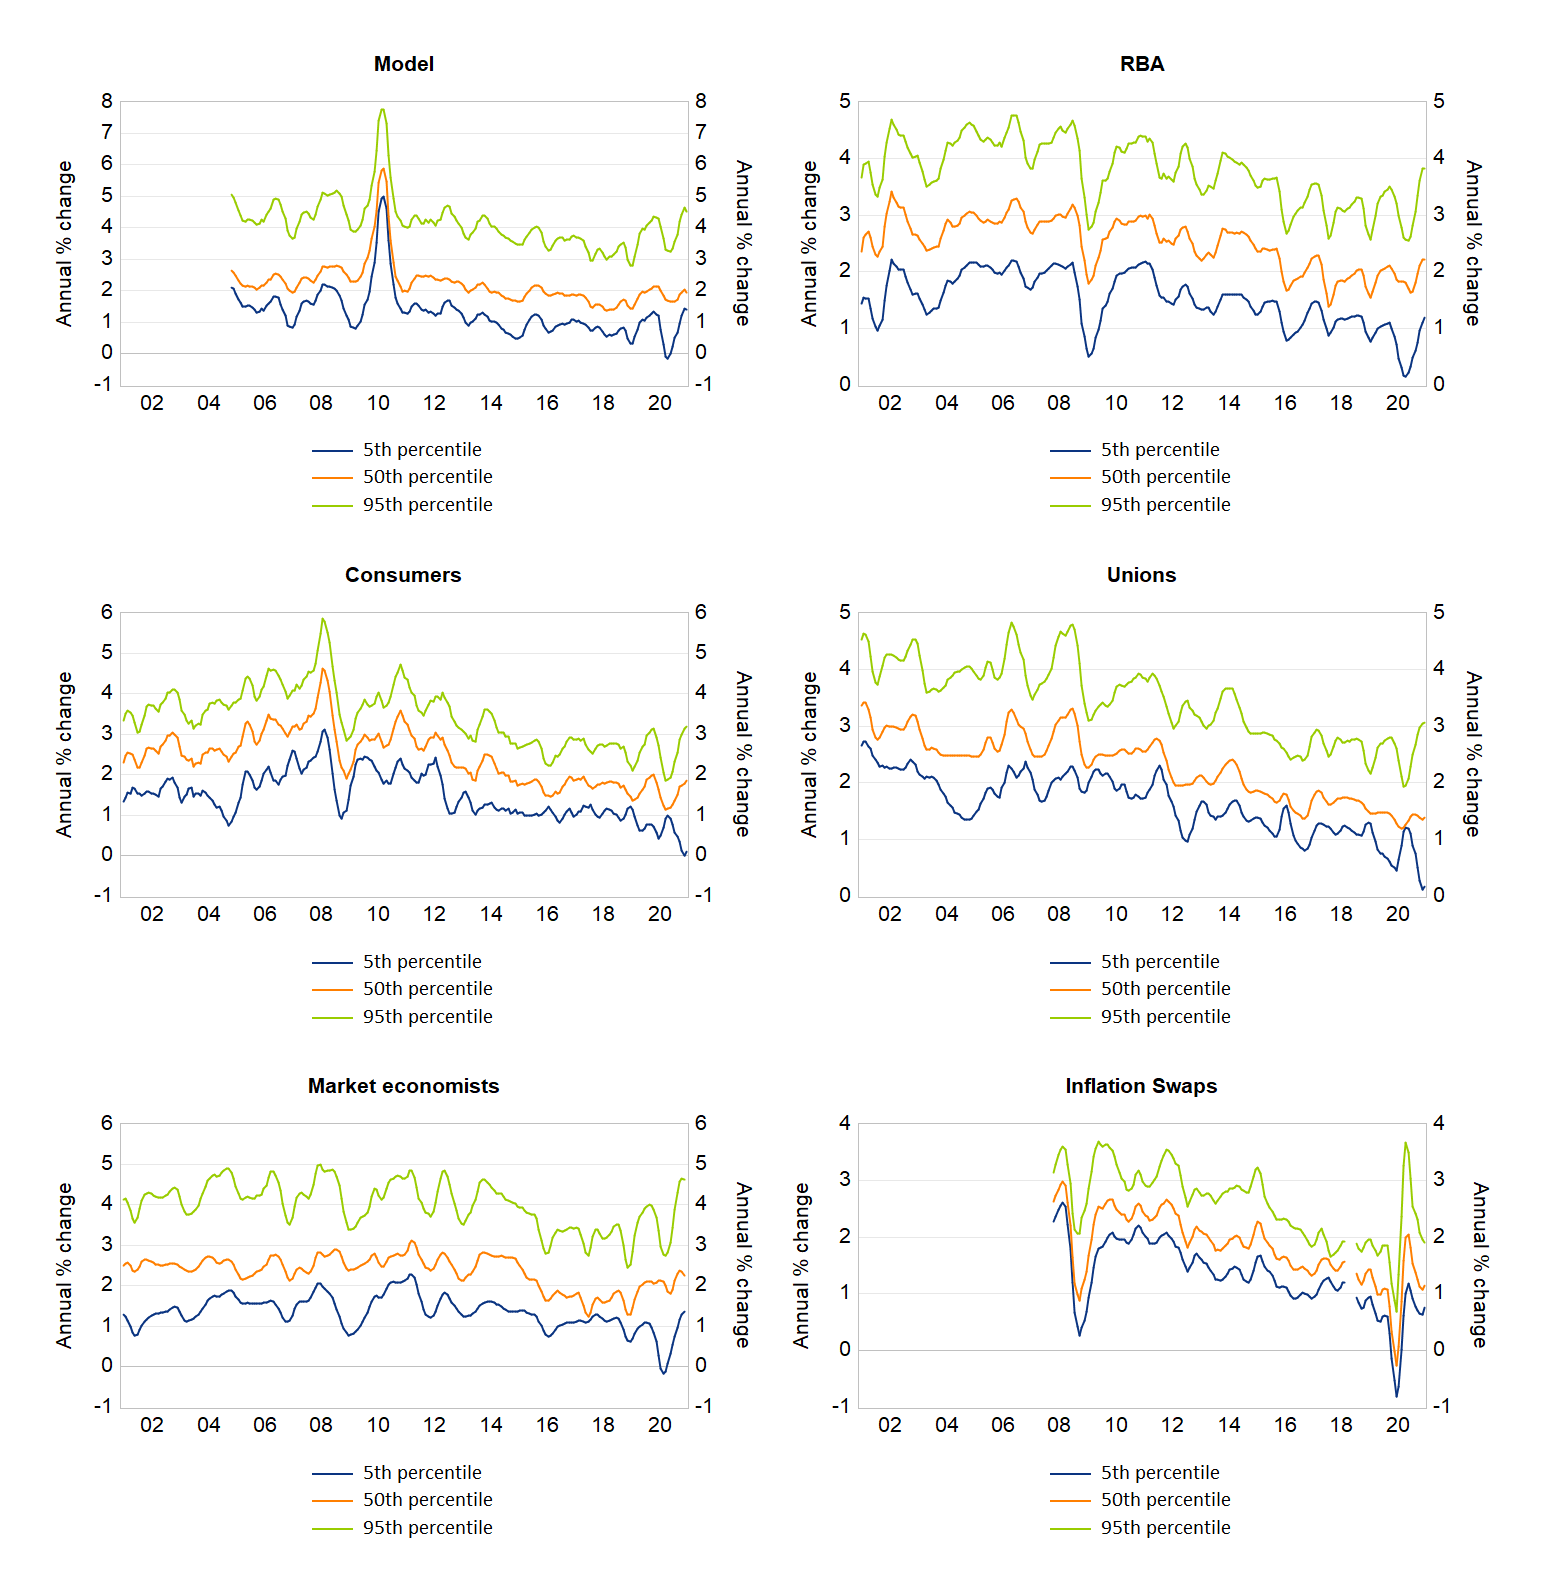
* These represent estimates of future inflation at low (5th), middle (50th) and high (95th) percentiles of the conditional distribution of inflation forecasts from the different sources. The technical appendix contains details on how the forecasts at the different percentiles are calculated.
Implications
The future path for inflation is less clear at present than it has been in some time. When visibility around future outcomes is limited it is important to not only consider the most likely result, but also the distribution of risks around this. By highlighting the range of potential outcomes and estimates of the probabilities of these being observed, this article aims to help readers more fully assess the uncertainty around the inflation outlook over the next two years. At present this is important as it is the horizon over which the RBA expects inflation to return to its target band. While the analysis in this note provides some support for this view, the majority of the estimates imply that inflation is more likely to still be below the RBA’s target in two years. There appears little chance of it being above target in two years time.